Cheektowaga: Fire Incidents, New York (NY)
Where are fire incidents reported in Cheektowaga, NY
Something went wrong! Please refresh the page.
| Fire incidents reported | |
|---|---|
| Sreet name | Count |
| GENESEE ST | 186 |
| WALDEN | 182 |
| WALDEN GALLERIA | 162 |
| GENESEE STREET | 160 |
| UNION RD | 150 |
| HARLEM RD | 136 |
| HARLEM ROAD | 134 |
| WALDEN AVE | 106 |
| BROADWAY | 90 |
| UNION | 90 |
| CLEVELAND DRIVE | 80 |
| THRUWAY PLAZA | 72 |
| UNION RD | 58 |
| THRUWAY PLAZA DR | 56 |
| ALPINE PLACE | 54 |
| UNION ROAD | 52 |
| HARLEM | 50 |
| MARYVALE DRIVE | 48 |
| WILLIAM | 48 |
| WINDWOOD COURT | 48 |
| PINE RIDGE ROAD | 46 |
| LOSSON RD | 42 |
| CLEVELAND DR | 38 |
| BEACH ROAD | 36 |
| DICK RD | 36 |
| GENESEE | 36 |
| MARYVALE DR | 34 |
| BUFFALO NIAGARA AIRPORT | 32 |
| HOERNER | 32 |
| ROSSLER | 30 |
| Other | 1,046 |
2002 - 2018 National Fire Incident Reporting System (NFIRS) incidents
- Incident types reported to NFIRS in Cheektowaga, NY
- 16,56649.7%Rescue & EMS
- 5,16615.5%Hazardous Condition
- 3,94411.8%False Alarm
- 3,37010.1%Fire
- 2,5207.6%Service Call
- 1,5784.7%Good Intent Call
- 1050.3%Severe Weather
- 690.2%Overpressure Rupture
- 360.1%Special Incident
- Fire incident types reported to NFIRS in Cheektowaga, NY
- 1,24136.8%Structure Fires
- 90626.9%Other
- 79123.5%Outside Fires
- 43212.8%Mobile Property/Vehicle Fires
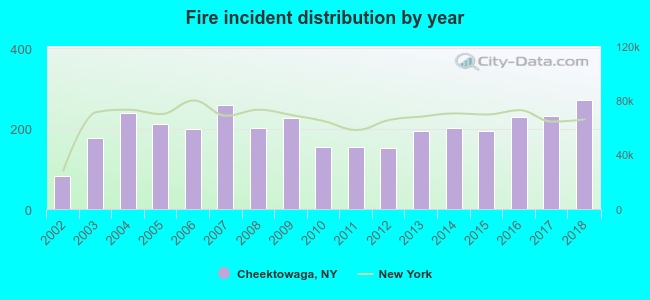 Based on the data from the years 2002 - 2018 the average number of fire incidents per year is 198. The highest number of reported fires - 270 took place in 2018, and the least - 81 in 2002. The data has a rising trend.
The average number of yearly fire incidents per 10k residents in Cheektowaga, NY compared to nearest cities:
(Note: Based on data for the last 3 years, including only cities with population 5,000 and above)
| Cheektowaga: | 32.4 |
| Depew: | 28.7 |
| Williamsville: | 100.3 |
| Eggertsville: | 1.0 |
| Lancaster: | 35.0 |
| Buffalo: | 16.1 |
| West Seneca: | 37.2 |
| Amherst: | 14.9 |
| Kenmore: | 21.9 |
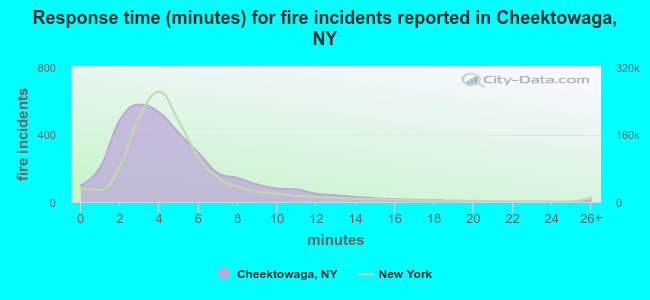 The median response time based on all reported fire incidents is 4 minutes. This is about the same as the New York median value.
The median response time in Cheektowaga, NY compared to nearest cities:
(Note: Based on data for all years, including only cities with at least 500 fire incidents)
| Cheektowaga: | 4 minutes |
| Depew: | 3 minutes |
| Williamsville: | 4 minutes |
| Lancaster: | 0 minutes |
| Buffalo: | 3 minutes |
| West Seneca: | 5 minutes |
| Amherst: | 4 minutes |
| Kenmore: | 2 minutes |
| Lackawanna: | 3 minutes |
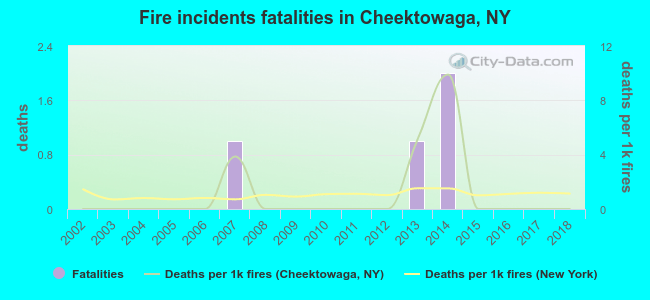 Based on the reports from the years 2002 - 2018 the average number of fire-related yearly deaths is 0. The highest number of deaths - 2 took place in 2014, and the lowest - 0 in 2002. The data has a constant trend.
The average number of deaths per 1,000 fire incidents is 1. This indicator was the highest - 10 in 2014, and the lowest 0 in 2002. The trend for deaths per 1,000 fires is constant. Compared to the New York value the number of deaths per 1,000 fires is similar.
Based on the reports from the years 2002 - 2018 the average number of fire-related yearly deaths is 0. The highest number of deaths - 2 took place in 2014, and the lowest - 0 in 2002. The data has a constant trend.
The average number of deaths per 1,000 fire incidents is 1. This indicator was the highest - 10 in 2014, and the lowest 0 in 2002. The trend for deaths per 1,000 fires is constant. Compared to the New York value the number of deaths per 1,000 fires is similar.Deaths per 1,000 incidents in Cheektowaga, NY compared to nearest cities:
(Note: Based on data for all years, including only cities with at least 2,500 fire incidents)
| Cheektowaga: | 1.2 |
| Buffalo: | 1.0 |
| West Seneca: | 0.8 |
| Niagara Falls: | 2.2 |
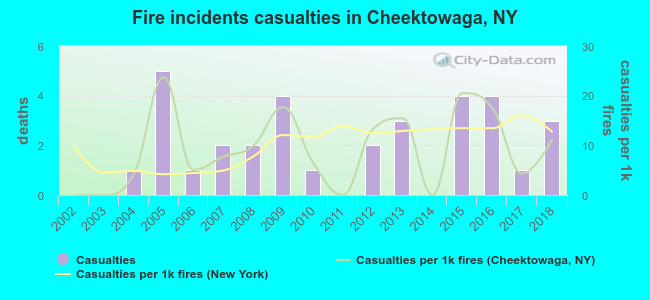 Based on the reports from the years 2002 - 2018 the average number of fire-related yearly casualties is 2. The highest number of casualties - 5 took place in 2005, and the lowest - 0 in 2002. The data has an increasing trend.
The average number of injuries per 1,000 fire incidents is 9. This indicator was the highest - 24 in 2005, and the lowest 0 in 2002. The trend for casualties per 1,000 fire incidents is increasing. Compared to the state value the number of casualties per 1,000 incidents is about the same.
Based on the reports from the years 2002 - 2018 the average number of fire-related yearly casualties is 2. The highest number of casualties - 5 took place in 2005, and the lowest - 0 in 2002. The data has an increasing trend.
The average number of injuries per 1,000 fire incidents is 9. This indicator was the highest - 24 in 2005, and the lowest 0 in 2002. The trend for casualties per 1,000 fire incidents is increasing. Compared to the state value the number of casualties per 1,000 incidents is about the same.Casualties per 1,000 incidents in Cheektowaga, NY compared to nearest cities:
(Note: Based on data for all years, including only cities with at least 500 fire incidents)
| Cheektowaga: | 9.8 |
| Depew: | 8.9 |
| Williamsville: | 3.3 |
| Lancaster: | 14.3 |
| Buffalo: | 5.5 |
| West Seneca: | 3.5 |
| Amherst: | 6.6 |
| Kenmore: | 35.6 |
| Lackawanna: | 18.9 |
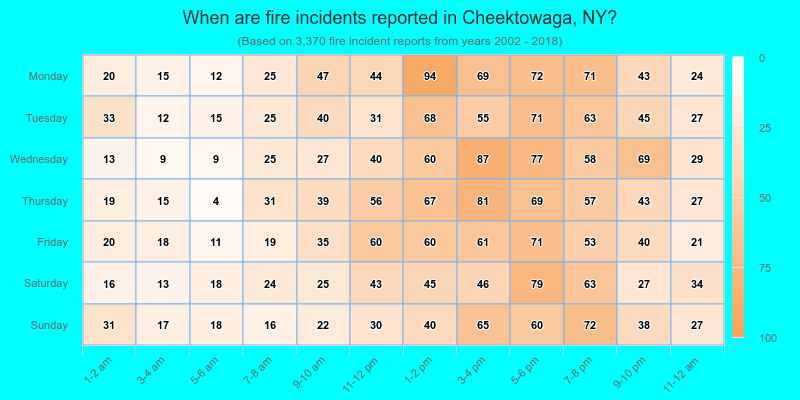
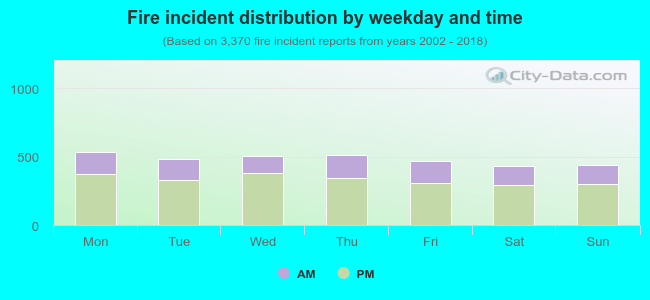 30.9% incidents where reported in the morning and 69.1% in the evening. The most fires (15.9%) took place on Monday, and the least (12.8%) on Saturday.
 According to the 3,370 fires from years 2002 - 2018 most fires (10.9%) took place during May, and the least (5.3%) in February.
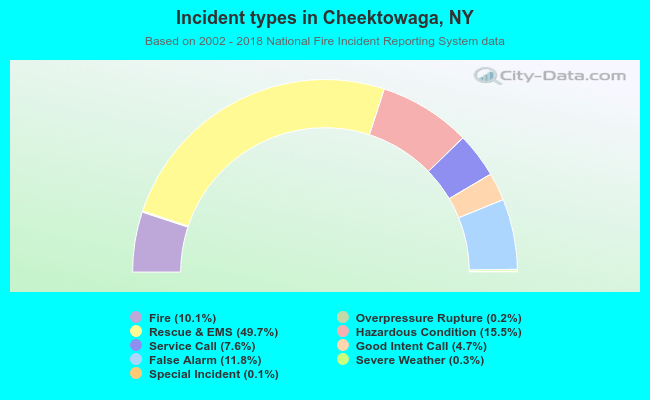 Out of all 33,354 cases reported during the years 2002 - 2018, the most belonged to the categories: Rescue & EMS (49.7%), Hazardous Condition (15.5%), and False Alarm (11.8%).
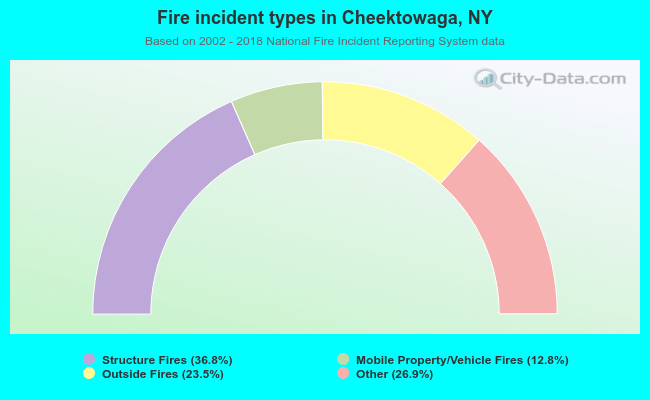 When looking into fire subcategories, the most reports belonged to: Structure Fires (36.8%), and Other (26.9%).