Tenafly: Fire Incidents, New Jersey (NJ)
Where are fire incidents reported in Tenafly, NJ
Something went wrong! Please refresh the page.
|
| |||||||||||||||||||||||||||||||||||||||||||||||||||||||||||||||||||||||||||||||||||||||||||||||||||||||||||||
2002 - 2018 National Fire Incident Reporting System (NFIRS) incidents
- Incident types reported to NFIRS in Tenafly, NJ
- 1,52449.5%False Alarm
- 96531.4%Hazardous Condition
- 2738.9%Fire
- 1565.1%Good Intent Call
- 913.0%Service Call
- 521.7%Rescue & EMS
- 160.5%Overpressure Rupture
- Fire incident types reported to NFIRS in Tenafly, NJ
- 18367.0%Structure Fires
- 6824.9%Outside Fires
- 217.7%Mobile Property/Vehicle Fires
- 10.4%Other
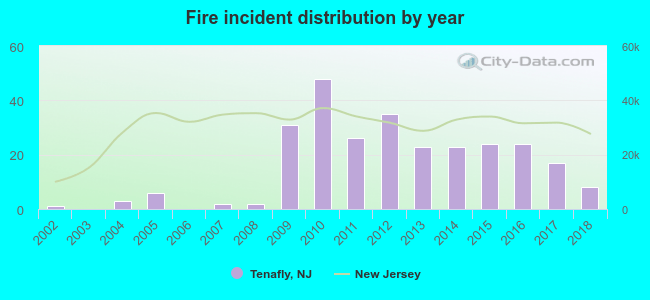 Based on the data from the years 2002 - 2018 the average number of fire incidents per year is 16. The highest number of reported fire incidents - 48 took place in 2010, and the least - 0 in 2003. The data has a rising trend.
The average number of yearly fire incidents per 10k residents in Tenafly, NJ compared to nearest cities:
(Note: Based on data for the last 3 years, including only cities with population 5,000 and above)
| Tenafly: | 11.0 |
| Cresskill: | 9.1 |
| Bergenfield: | 27.6 |
| Englewood: | 88.8 |
| Dumont: | 20.0 |
| Englewood Cliffs: | 18.0 |
| New Milford: | 8.2 |
| Teaneck: | 47.0 |
| Closter: | 14.0 |

 23.8% incidents where reported in the morning and 76.2% in the evening. The most fires (17.9%) took place on Sunday, and the least (10.3%) on Saturday.
 According to the 273 reports from years 2002 - 2018 most fires (13.2%) took place during April, and the least (4.4%) in August.
 Out of all 3,077 cases reported during the years 2002 - 2018, the most belonged to the categories: False Alarm (49.5%), Hazardous Condition (31.4%), and Fire (8.9%).
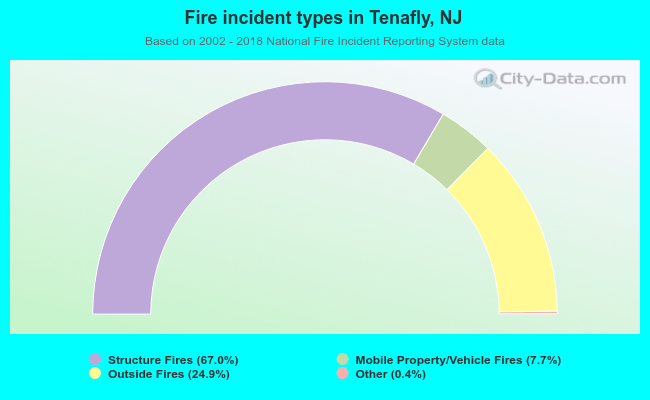 When looking into fire subcategories, the most incidents belonged to: Structure Fires (67.0%), and Outside Fires (24.9%).