Cresskill: Fire Incidents, New Jersey (NJ)
Where are fire incidents reported in Cresskill, NJ
Something went wrong! Please refresh the page.
|
| |||||||||||||||||||||||||||||||||||||||||||||||||||||||||||||||||||||||||||||||||||||||||||||||||||||||||||||
2004 - 2018 National Fire Incident Reporting System (NFIRS) incidents
- Incident types reported to NFIRS in Cresskill, NJ
- 94634.0%False Alarm
- 72225.9%Hazardous Condition
- 51218.4%Rescue & EMS
- 36213.0%Service Call
- 1324.7%Good Intent Call
- 1073.8%Fire
- Fire incident types reported to NFIRS in Cresskill, NJ
- 5551.4%Structure Fires
- 3734.6%Outside Fires
- 1211.2%Mobile Property/Vehicle Fires
- 32.8%Other
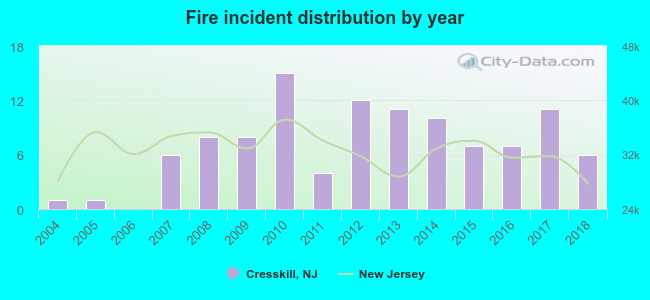 Based on the data from the years 2004 - 2018 the average number of fire incidents per year is 7. The highest number of fire incidents - 15 took place in 2010, and the least - 0 in 2006. The data has a rising trend.
The average number of yearly fire incidents per 10k residents in Cresskill, NJ compared to nearest cities:
(Note: Based on data for the last 3 years, including only cities with population 5,000 and above)
| Cresskill: | 9.1 |
| Tenafly: | 11.0 |
| Dumont: | 20.0 |
| Closter: | 14.0 |
| Bergenfield: | 27.6 |
| New Milford: | 8.2 |
| Englewood: | 88.8 |
| Norwood: | 14.9 |
| Oradell: | 32.7 |

 32.7% incidents where reported in the morning and 67.3% in the evening. The most fires (20.6%) took place on Friday, and the least (11.2%) on Thursday.
 Based on the 107 fires from years 2004 - 2018 most fires (15.9%) took place during February, and the least (1.9%) in August.
 Out of all 2,783 cases reported during the years 2004 - 2018, the most belonged to the categories: False Alarm (34.0%), Hazardous Condition (25.9%), and Rescue & EMS (18.4%).
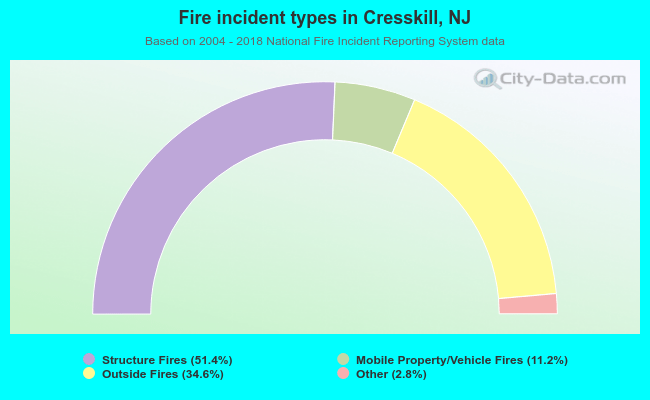 When looking into fire subcategories, the most reports belonged to: Structure Fires (51.4%), and Outside Fires (34.6%).