Sterling: Fire Incidents, Virginia (VA)
Where are fire incidents reported in Sterling, VA
Something went wrong! Please refresh the page.
| Fire incidents reported | |
|---|---|
| Sreet name | Count |
| STERLING BLVD | 100 |
| SULLY RD | 90 |
| HARRY BYRD HWY | 58 |
| COMMUNITY PLZ | 52 |
| OLD OX RD | 50 |
| SHAW RD | 44 |
| SUGARLAND RUN DR | 44 |
| YOUNGS CLIFF RD | 40 |
| CHURCH RD | 38 |
| HUNTINGTON SQ | 38 |
| REGAL PLZ | 38 |
| ALGONKIAN PKY | 36 |
| ENTERPRISE ST | 34 |
| RESERVE FALLS TER | 32 |
| SEVERN WAY | 32 |
| STANFORD SQ | 32 |
| DULLES TOWN CIR | 30 |
| CASCADES PKY | 28 |
| PACIFIC BLVD | 28 |
| PIDGEON HILL DR | 28 |
| DAVIS DR | 26 |
| HARRY BYRD HWY | 26 |
| POTOMAC RUN PLZ | 26 |
| POTOMAC VIEW RD | 26 |
| CATALINA CT | 24 |
| POPLAR RD | 24 |
| RIDGETOP CIR | 24 |
| CHASE HERITAGE CIR | 22 |
| LINCOLN AVE | 22 |
| SOUTHBANK ST | 22 |
| Other | 1,715 |
2002 - 2018 National Fire Incident Reporting System (NFIRS) incidents
- Incident types reported to NFIRS in Sterling, VA
- 6,74134.0%Rescue & EMS
- 3,58018.1%Hazardous Condition
- 2,82914.3%Fire
- 2,75113.9%False Alarm
- 2,56512.9%Good Intent Call
- 1,2236.2%Service Call
- 750.4%Special Incident
- 560.3%Overpressure Rupture
- Fire incident types reported to NFIRS in Sterling, VA
- 1,26544.7%Structure Fires
- 98935.0%Outside Fires
- 40314.2%Mobile Property/Vehicle Fires
- 1726.1%Other
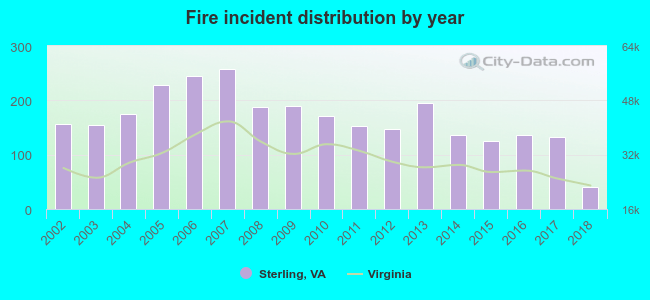 According to the data from the years 2002 - 2018 the average number of fire incidents per year is 166. The highest number of reported fire incidents - 257 took place in 2007, and the least - 40 in 2018. The data has a decreasing trend.
The average number of yearly fire incidents per 10k residents in Sterling, VA compared to nearest cities:
(Note: Based on data for the last 3 years, including only cities with population 5,000 and above)
| Sterling: | 37.0 |
| Herndon: | 56.5 |
| Ashburn: | 31.0 |
| Reston: | 15.5 |
| Lansdowne: | 0.9 |
| South Riding: | 2.5 |
| Great Falls: | 20.1 |
| Stone Ridge: | 1.4 |
| Chantilly: | 39.8 |
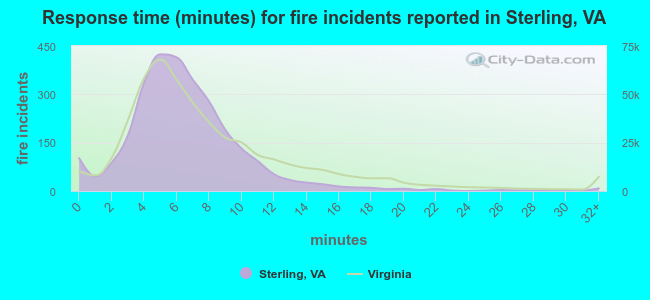 The median response time based on all reported fire incidents is 6 minutes. This is similar to the Virginia median value.
The median response time in Sterling, VA compared to nearest cities:
(Note: Based on data for all years, including only cities with at least 500 fire incidents)
| Sterling: | 6 minutes |
| Herndon: | 5 minutes |
| Ashburn: | 6 minutes |
| Reston: | 5 minutes |
| Chantilly: | 6 minutes |
| Leesburg: | 7 minutes |
| Centreville: | 6 minutes |
| Vienna: | 5 minutes |
| Fairfax: | 6 minutes |
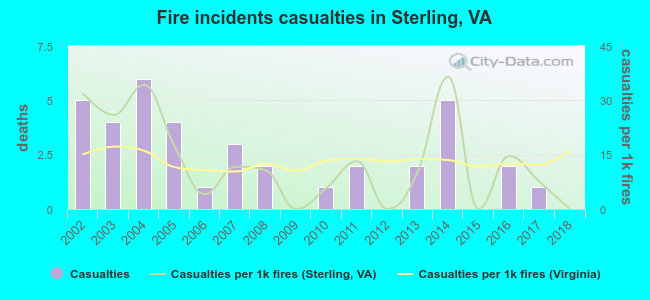 Based on the reports from the years 2002 - 2018 the average number of fire-related yearly casualties is 2. The highest number of casualties - 6 took place in 2004, and the lowest - 0 in 2009. The data has a decreasing trend.
The average number of injuries per 1,000 fire incidents is 13. This indicator was the highest - 36 in 2014, and the lowest 0 in 2009. The trend for injuries per 1,000 incidents is declining. Compared to the state value the number of injuries per 1,000 fire incidents is about the same.
Based on the reports from the years 2002 - 2018 the average number of fire-related yearly casualties is 2. The highest number of casualties - 6 took place in 2004, and the lowest - 0 in 2009. The data has a decreasing trend.
The average number of injuries per 1,000 fire incidents is 13. This indicator was the highest - 36 in 2014, and the lowest 0 in 2009. The trend for injuries per 1,000 incidents is declining. Compared to the state value the number of injuries per 1,000 fire incidents is about the same.
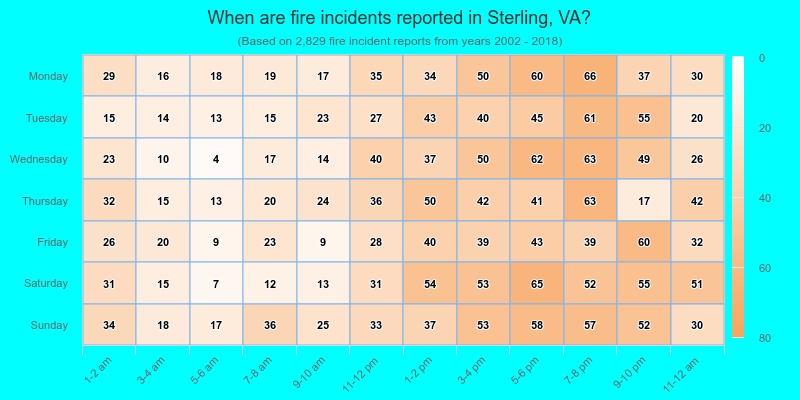
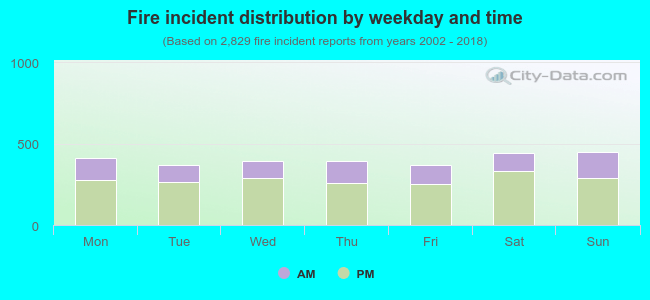 31.0% incidents where reported in the morning and 69.0% in the evening. The most fires (15.9%) took place on Sunday, and the least (13.0%) on Friday.
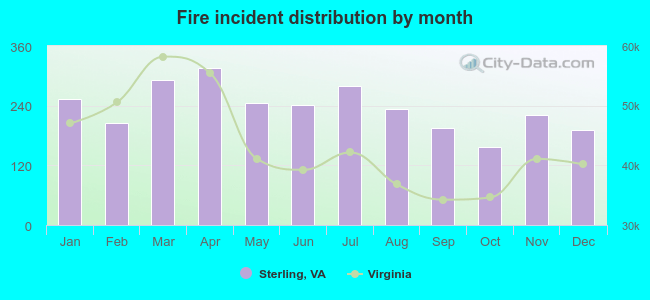 Based on the 2,829 fire incidents from years 2002 - 2018 most fires (11.1%) took place during April, and the least (5.5%) in October.
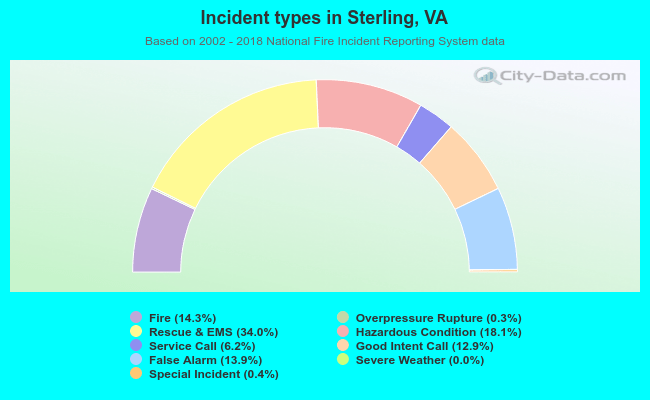 Out of all 19,827 cases reported during the years 2002 - 2018, the most belonged to the categories: Rescue & EMS (34.0%), Hazardous Condition (18.1%), and Fire (14.3%).
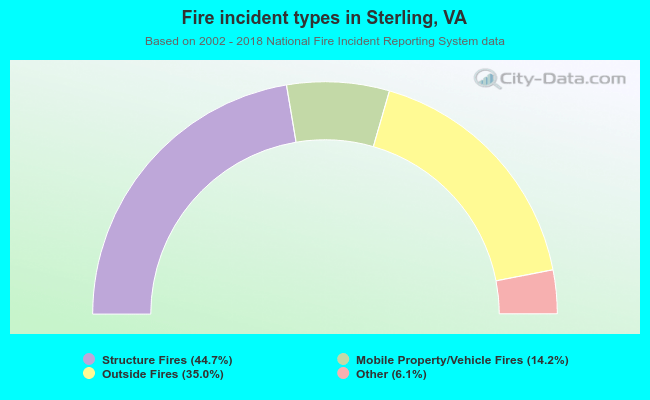 When looking into fire subcategories, the most incidents belonged to: Structure Fires (44.7%), and Outside Fires (35.0%).