Great Falls: Fire Incidents, Virginia (VA)
Where are fire incidents reported in Great Falls, VA
Something went wrong! Please refresh the page.
|
| |||||||||||||||||||||||||||||||||||||||||||||||||||||||||||||||||||||||||||||||||||||||||||||||||||||||||||||
2006 - 2018 National Fire Incident Reporting System (NFIRS) incidents
- Incident types reported to NFIRS in Great Falls, VA
- 3,04456.5%Rescue & EMS
- 61211.4%False Alarm
- 5209.7%Good Intent Call
- 4618.6%Hazardous Condition
- 4187.8%Service Call
- 3075.7%Fire
- 110.2%Special Incident
- 90.2%Severe Weather
- Fire incident types reported to NFIRS in Great Falls, VA
- 13544.0%Outside Fires
- 12841.7%Structure Fires
- 3611.7%Mobile Property/Vehicle Fires
- 82.6%Other
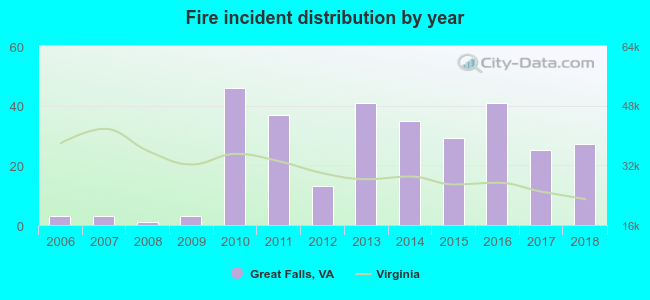 Based on the data from the years 2006 - 2018 the average number of fire incidents per year is 23. The highest number of fire incidents - 46 took place in 2010, and the least - 1 in 2008. The data has an increasing trend.
The average number of yearly fire incidents per 10k residents in Great Falls, VA compared to nearest cities:
(Note: Based on data for the last 3 years, including only cities with population 5,000 and above)
| Great Falls: | 20.1 |
| Reston: | 15.5 |
| Herndon: | 56.5 |
| Vienna: | 45.6 |
| McLean: | 19.5 |
| Sterling: | 37.0 |
| Dunn Loring: | 5.7 |
| Oakton: | 10.0 |
| Idylwood: | 6.9 |

 24.4% incidents where reported in the morning and 75.6% in the evening. The most fires (18.6%) took place on Sunday, and the least (10.1%) on Tuesday.
 According to the 307 fire incidents from years 2006 - 2018 most fires (13.4%) took place during April, and the least (5.2%) in June.
 Out of all 5,386 cases reported during the years 2006 - 2018, the most belonged to the categories: Rescue & EMS (56.5%), False Alarm (11.4%), and Good Intent Call (9.7%).
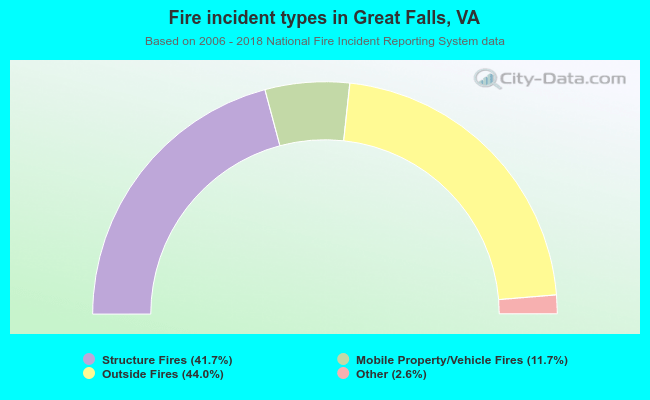 When looking into fire subcategories, the most reports belonged to: Outside Fires (44.0%), and Structure Fires (41.7%).