St. Augustine: Fire Incidents, Florida (FL)
Where are fire incidents reported in St. Augustine, FL
Something went wrong! Please refresh the page.
| Fire incidents reported | |
|---|---|
| Sreet name | Count |
| US 1 | 562 |
| INTERSTATE 95 | 360 |
| I95 | 286 |
| STATE ROAD 16 | 246 |
| A1A | 170 |
| STATE ROAD 207 | 154 |
| PONCE DE LEON BLVD | 128 |
| COUNTY ROAD 13 | 112 |
| KING ST | 104 |
| STATE ROAD 13 | 90 |
| STATE ROAD 206 | 90 |
| COUNTY ROAD 208 | 80 |
| OLD MOULTRIE RD | 74 |
| COUNTY ROAD 210 | 70 |
| WILDWOOD DR | 68 |
| WHITNEY ST | 60 |
| COASTAL HWY | 58 |
| PONTE VEDRA BLVD | 56 |
| ROSCOE BLVD | 54 |
| SAN MARCO AVE | 54 |
| HOLMES BLVD | 52 |
| PACETTI RD | 52 |
| COUNTY ROAD 16A | 50 |
| INTERNATIONAL GOLF PKWY | 48 |
| CYPRESS RD | 44 |
| CENTURY BLVD | 42 |
| OLD DIXIE HWY | 42 |
| RIBERIA ST | 42 |
| STRATTON RD | 42 |
| STATE ROAD 312 | 40 |
| Other | 1,558 |
2002 - 2011 National Fire Incident Reporting System (NFIRS) incidents
- Incident types reported to NFIRS in St. Augustine, FL
- 10,88649.3%Rescue & EMS
- 4,88822.1%Fire
- 3,15414.3%Hazardous Condition
- 1,6127.3%Service Call
- 8183.7%Good Intent Call
- 6793.1%False Alarm
- 260.1%Special Incident
- Fire incident types reported to NFIRS in St. Augustine, FL
- 2,74356.1%Outside Fires
- 1,17324.0%Structure Fires
- 76715.7%Mobile Property/Vehicle Fires
- 2054.2%Other
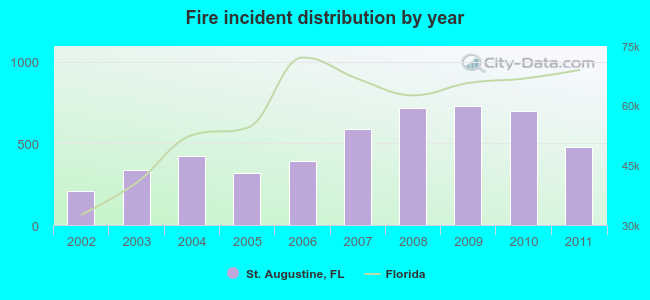 Based on the data from the years 2002 - 2011 the average number of fire incidents per year is 489. The highest number of fires - 730 took place in 2009, and the least - 208 in 2002. The data has a growing trend.
 The median response time based on all reported fire incidents is 8 minutes. This is higher than the state median value.
The median response time in St. Augustine, FL compared to nearest cities:
(Note: Based on data for all years, including only cities with at least 500 fire incidents)
| St. Augustine: | 8 minutes |
| Hastings: | 12 minutes |
| Palm Coast: | 6 minutes |
| Palatka: | 6 minutes |
| Jacksonville Beach: | 4 minutes |
| Bunnell: | 12 minutes |
| Orange Park: | 6 minutes |
| Jacksonville: | 6 minutes |
| Middleburg: | 10 minutes |
 According to the data from the years 2002 - 2011 the average number of fire-related yearly deaths is 1. The highest number of reported deaths - 2 took place in 2003, and the lowest - 0 in 2002. The data has a constant trend.
The average number of fatalities per 1,000 fires is 3. This indicator was the highest - 6 in 2005, and the lowest 0 in 2002. The trend for deaths per 1,000 incidents is constant. Compared to the state value the number of deaths per 1,000 fire incidents is higher.
According to the data from the years 2002 - 2011 the average number of fire-related yearly deaths is 1. The highest number of reported deaths - 2 took place in 2003, and the lowest - 0 in 2002. The data has a constant trend.
The average number of fatalities per 1,000 fires is 3. This indicator was the highest - 6 in 2005, and the lowest 0 in 2002. The trend for deaths per 1,000 incidents is constant. Compared to the state value the number of deaths per 1,000 fire incidents is higher.Deaths per 1,000 incidents in St. Augustine, FL compared to nearest cities:
(Note: Based on data for all years, including only cities with at least 2,500 fire incidents)
| St. Augustine: | 2.3 |
| Palm Coast: | 3.1 |
| Palatka: | 1.1 |
| Jacksonville: | 2.1 |
| Ormond Beach: | 2.3 |
| Daytona Beach: | 2.4 |
 According to the reports from the years 2002 - 2011 the average number of fire-related casualties per year is 6. The highest number of reported injuries - 12 took place in 2009, and the lowest - 2 in 2002. The data has a rising trend.
The average number of injuries per 1,000 fires is 11. This indicator was the highest - 24 in 2003, and the lowest 5 in 2006. The trend for casualties per 1,000 fire incidents is rising. Compared to the Florida value the number of casualties per 1,000 fire incidents is similar.
According to the reports from the years 2002 - 2011 the average number of fire-related casualties per year is 6. The highest number of reported injuries - 12 took place in 2009, and the lowest - 2 in 2002. The data has a rising trend.
The average number of injuries per 1,000 fires is 11. This indicator was the highest - 24 in 2003, and the lowest 5 in 2006. The trend for casualties per 1,000 fire incidents is rising. Compared to the Florida value the number of casualties per 1,000 fire incidents is similar.Casualties per 1,000 incidents in St. Augustine, FL compared to nearest cities:
(Note: Based on data for all years, including only cities with at least 500 fire incidents)
| St. Augustine: | 11.7 |
| Hastings: | 17.4 |
| Palm Coast: | 8.4 |
| Palatka: | 9.4 |
| Jacksonville Beach: | 43.7 |
| Bunnell: | 1.9 |
| Orange Park: | 0.5 |
| Jacksonville: | 8.7 |
| Middleburg: | 1.0 |
 27.6% incidents where reported in the morning and 72.4% in the evening. The most fires (15.1%) took place on Saturday, and the least (13.3%) on Wednesday.
 Based on the 4,888 reports from years 2002 - 2011 most fires (10.5%) took place during April, and the least (6.4%) in September.
 Out of all 22,090 cases reported during the years 2002 - 2011, the most belonged to the categories: Rescue & EMS (49.3%), Fire (22.1%), and Hazardous Condition (14.3%).
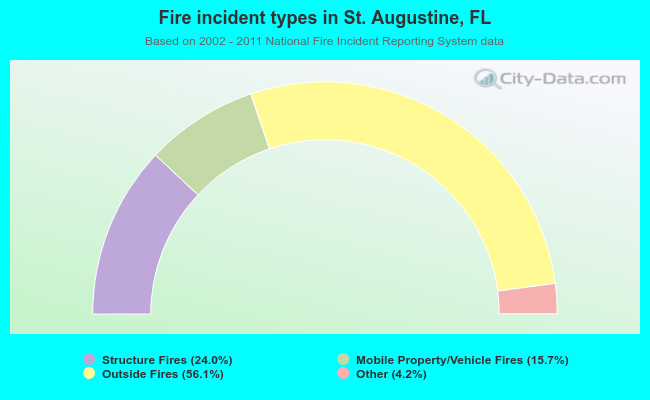 When looking into fire subcategories, the most reports belonged to: Outside Fires (56.1%), and Structure Fires (24.0%).