Jacksonville Beach: Fire Incidents, Florida (FL)
Where are fire incidents reported in Jacksonville Beach, FL
Something went wrong! Please refresh the page.
| Fire incidents reported | |
|---|---|
| Sreet name | Count |
| 3RD ST | 294 |
| 1ST ST | 206 |
| BEACH BLVD | 158 |
| 2ND AVE | 68 |
| 1ST AVE | 64 |
| 2ND ST | 64 |
| PENMAN RD | 60 |
| MARSH LANDING PKY | 52 |
| 16TH AVE | 50 |
| THE GREENS WAY | 50 |
| BEACH PROPER | 44 |
| 13TH AVE | 40 |
| 5TH AVE | 40 |
| 7TH AVE | 38 |
| 8TH AVE | 38 |
| SHETTER AVE | 36 |
| 9TH AVE | 34 |
| 15TH AVE | 30 |
| 4TH AVE | 30 |
| 6TH AVE | 30 |
| 11TH AVE | 28 |
| 3RD AVE | 28 |
| 6TH ST | 26 |
| 10TH ST | 24 |
| 12TH AVE | 24 |
| 4TH ST | 22 |
| 14TH AVE | 20 |
| 17TH AVE | 20 |
| 9TH ST | 20 |
| 10TH AVE | 18 |
2003 - 2018 National Fire Incident Reporting System (NFIRS) incidents
- Incident types reported to NFIRS in Jacksonville Beach, FL
- 10,91563.1%Rescue & EMS
- 1,6229.4%False Alarm
- 1,5368.9%Service Call
- 1,1896.9%Fire
- 1,1066.4%Good Intent Call
- 8865.1%Hazardous Condition
- 300.2%Special Incident
- Fire incident types reported to NFIRS in Jacksonville Beach, FL
- 58349.0%Outside Fires
- 40233.8%Structure Fires
- 17214.5%Mobile Property/Vehicle Fires
- 322.7%Other
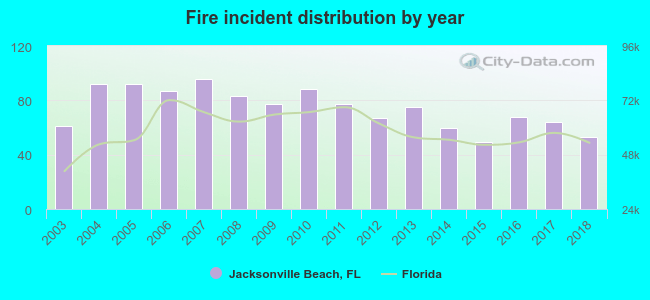 According to the data from the years 2003 - 2018 the average number of fire incidents per year is 74. The highest number of reported fires - 96 took place in 2007, and the least - 49 in 2015. The data has a declining trend.
The average number of yearly fire incidents per 10k residents in Jacksonville Beach, FL compared to nearest cities:
(Note: Based on data for the last 3 years, including only cities with population 5,000 and above)
| Jacksonville Beach: | 27.2 |
| Neptune Beach: | 2.3 |
| Atlantic Beach: | 3.3 |
| Ponte Vedra: | 11.0 |
| Jacksonville: | 6.4 |
| Orange Park: | 19.8 |
| Fleming Island: | 1.3 |
| Yulee: | 63.8 |
| Fernandina Beach: | 51.2 |
 The median response time based on all reported fire incidents is 4 minutes. This is lower than the state median value.
The median response time in Jacksonville Beach, FL compared to nearest cities:
(Note: Based on data for all years, including only cities with at least 500 fire incidents)
| Jacksonville Beach: | 4 minutes |
| Jacksonville: | 6 minutes |
| Orange Park: | 6 minutes |
| Yulee: | 9 minutes |
| Fernandina Beach: | 6 minutes |
| St. Augustine: | 8 minutes |
| Callahan: | 9 minutes |
| Middleburg: | 10 minutes |
| Hastings: | 12 minutes |
 Based on the data from the years 2003 - 2018 the average number of fire-related casualties per year is 3. The highest number of injuries - 7 took place in 2008, and the lowest - 0 in 2015. The data has a dropping trend.
The average number of casualties per 1,000 fires is 44. This indicator was the highest - 104 in 2012, and the lowest 0 in 2015. The trend for casualties per 1,000 fires is decreasing. Compared to the Florida value the number of casualties per 1,000 fire incidents is much higher.
Based on the data from the years 2003 - 2018 the average number of fire-related casualties per year is 3. The highest number of injuries - 7 took place in 2008, and the lowest - 0 in 2015. The data has a dropping trend.
The average number of casualties per 1,000 fires is 44. This indicator was the highest - 104 in 2012, and the lowest 0 in 2015. The trend for casualties per 1,000 fires is decreasing. Compared to the Florida value the number of casualties per 1,000 fire incidents is much higher.Casualties per 1,000 incidents in Jacksonville Beach, FL compared to nearest cities:
(Note: Based on data for all years, including only cities with at least 500 fire incidents)
| Jacksonville Beach: | 43.7 |
| Jacksonville: | 8.7 |
| Orange Park: | 0.5 |
| Yulee: | 0.5 |
| Fernandina Beach: | 3.2 |
| St. Augustine: | 11.7 |
| Callahan: | 1.0 |
| Middleburg: | 1.0 |
| Hastings: | 17.4 |
 34.7% incidents where reported in the morning and 65.3% in the evening. The most fires (17.4%) took place on Monday, and the least (12.6%) on Tuesday.
 Based on the 1,189 fire incidents from years 2003 - 2018 most fires (11.0%) took place during May, and the least (6.2%) in August.
 Out of all 17,311 cases reported during the years 2003 - 2018, the most belonged to the categories: Rescue & EMS (63.1%), False Alarm (9.4%), and Service Call (8.9%).
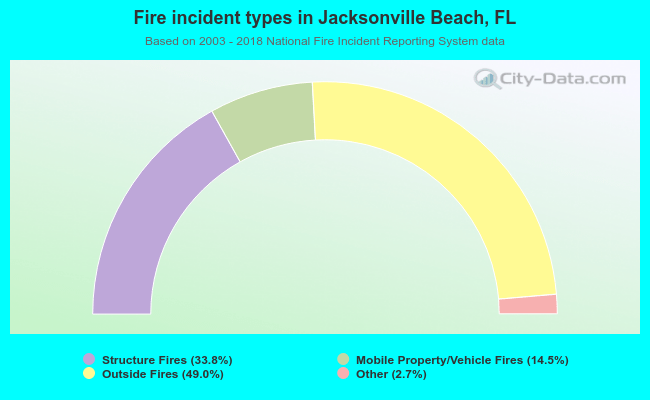 When looking into fire subcategories, the most incidents belonged to: Outside Fires (49.0%), and Structure Fires (33.8%).