Springdale: Fire Incidents, Ohio (OH)
Where are fire incidents reported in Springdale, OH
Something went wrong! Please refresh the page.
| Fire incidents reported | |
|---|---|
| Sreet name | Count |
| KEMPER RD | 406 |
| PRINCETON PIKE | 356 |
| SPRINGFIELD PIKE | 290 |
| CHESTERDALE DR | 130 |
| 275 | 80 |
| GLENSPRINGS DR | 78 |
| NORTHLAND BLVD | 72 |
| CHESTERDALE CIR | 60 |
| CRESCENTVILLE RD | 58 |
| LAWNVIEW AVE | 58 |
| CHESTERWOOD CT | 54 |
| CHESTERDALE RD | 44 |
| PROGRESS PL | 38 |
| SMILEY AVE | 38 |
| GRANDIN AVE | 32 |
| KEMPER COMMONS DR | 32 |
| CHESTERDALE CT | 28 |
| MERCHANT ST | 28 |
| COMMONS DR | 26 |
| TRI-COUNTY PKY | 26 |
| KENN RD | 24 |
| OLDE GATE DR | 24 |
| CEDARHILL DR | 22 |
| SHARON RD | 22 |
| LEDRO ST | 20 |
| YORKHAVEN RD | 18 |
| BANCROFT CIR | 16 |
| CONTAINER PL | 16 |
| NEUSS AVE | 16 |
| NORTHWEST BLVD | 16 |
2002 - 2018 National Fire Incident Reporting System (NFIRS) incidents
- Incident types reported to NFIRS in Springdale, OH
- 2,69332.5%Rescue & EMS
- 1,66020.1%Fire
- 1,39416.8%False Alarm
- 1,19414.4%Hazardous Condition
- 1,01612.3%Good Intent Call
- 2773.3%Service Call
- 320.4%Overpressure Rupture
- 100.1%Severe Weather
- Fire incident types reported to NFIRS in Springdale, OH
- 82249.5%Structure Fires
- 53432.2%Outside Fires
- 28517.2%Mobile Property/Vehicle Fires
- 191.1%Other
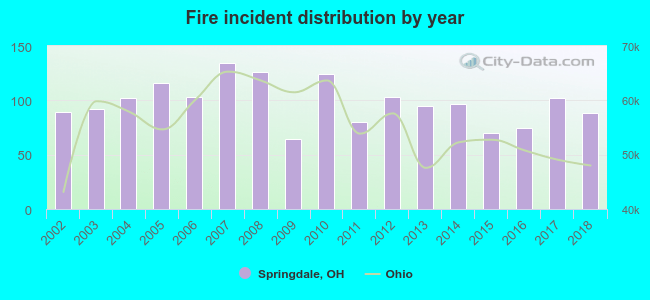 According to the data from the years 2002 - 2018 the average number of fire incidents per year is 98. The highest number of fire incidents - 134 took place in 2007, and the least - 64 in 2009. The data has a decreasing trend.
The average number of yearly fire incidents per 10k residents in Springdale, OH compared to nearest cities:
(Note: Based on data for the last 3 years, including only cities with population 5,000 and above)
| Springdale: | 78.8 |
| Forest Park: | 42.0 |
| Fairfield: | 23.7 |
| Wyoming: | 21.0 |
| Sharonville: | 65.8 |
| Reading: | 56.7 |
| Mount Healthy: | 2.7 |
| North College Hill: | 23.5 |
| Blue Ash: | 53.8 |
 The median response time based on all reported fire incidents is 5 minutes. This is lower compared to the state median value.
The median response time in Springdale, OH compared to nearest cities:
(Note: Based on data for all years, including only cities with at least 500 fire incidents)
| Springdale: | 5 minutes |
| Forest Park: | 5 minutes |
| Woodlawn: | 5 minutes |
| Lincoln Heights: | 5 minutes |
| Fairfield: | 5 minutes |
| Evendale: | 5 minutes |
| Wyoming: | 5 minutes |
| Sharonville: | 6 minutes |
| Lockland: | 6 minutes |
 According to the reports from the years 2002 - 2018 the average number of fire-related yearly casualties is 2. The highest number of injuries - 4 took place in 2003, and the lowest - 0 in 2014. The data has a growing trend.
The average number of injuries per 1,000 fires is 21. This indicator was the highest - 45 in 2018, and the lowest 0 in 2014. The trend for injuries per 1,000 fires is increasing. Compared to the Ohio value the number of casualties per 1,000 incidents is higher.
According to the reports from the years 2002 - 2018 the average number of fire-related yearly casualties is 2. The highest number of injuries - 4 took place in 2003, and the lowest - 0 in 2014. The data has a growing trend.
The average number of injuries per 1,000 fires is 21. This indicator was the highest - 45 in 2018, and the lowest 0 in 2014. The trend for injuries per 1,000 fires is increasing. Compared to the Ohio value the number of casualties per 1,000 incidents is higher.Casualties per 1,000 incidents in Springdale, OH compared to nearest cities:
(Note: Based on data for all years, including only cities with at least 500 fire incidents)
| Springdale: | 21.1 |
| Forest Park: | 26.3 |
| Woodlawn: | 3.8 |
| Lincoln Heights: | 0.0 |
| Fairfield: | 10.8 |
| Evendale: | 3.7 |
| Wyoming: | 6.8 |
| Sharonville: | 6.8 |
| Lockland: | 11.9 |
 29.2% incidents where reported in the morning and 70.8% in the evening. The most fires (16.6%) took place on Saturday, and the least (12.0%) on Tuesday.
 According to the 1,660 reports from years 2002 - 2018 most fires (11.6%) took place during June, and the least (4.2%) in February.
 Out of all 8,279 cases reported during the years 2002 - 2018, the most belonged to the categories: Rescue & EMS (32.5%), Fire (20.1%), and False Alarm (16.8%).
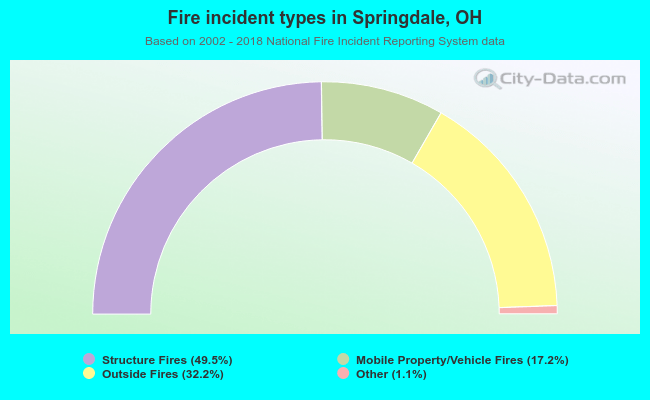 When looking into fire subcategories, the most reports belonged to: Structure Fires (49.5%), and Outside Fires (32.2%).