Reading: Fire Incidents, Ohio (OH)
Where are fire incidents reported in Reading, OH
Something went wrong! Please refresh the page.
| Fire incidents reported | |
|---|---|
| Sreet name | Count |
| READING RD | 354 |
| BENSON ST | 122 |
| GALBRAITH RD | 100 |
| COLUMBIA AVE | 66 |
| JEFFERSON AVE | 66 |
| LAKESHORE DR | 62 |
| GAHL TER | 56 |
| NORTH ST | 48 |
| WEST ST | 46 |
| HUNT RD | 32 |
| SOUTHERN AVE | 32 |
| ALJOY CT | 30 |
| RONALD REAGAN HWY | 30 |
| VINE ST | 30 |
| LAKEVIEW DR | 28 |
| CLARK RD | 24 |
| KOEHLER AVE | 24 |
| KOENIG AVE | 24 |
| MAPLE DR | 24 |
| BOLSER DR | 22 |
| READING | 22 |
| BENSON | 20 |
| PIKE ST | 18 |
| SOUTH TERRACE DR | 16 |
| THIRD ST | 16 |
| THURNRIDGE DR | 16 |
| FUHRMAN RD | 14 |
| GALBRAITH | 14 |
| JEFFERSON | 14 |
| MARKET ST | 14 |
2002 - 2018 National Fire Incident Reporting System (NFIRS) incidents
- Incident types reported to NFIRS in Reading, OH
- 7,65264.6%Rescue & EMS
- 1,0588.9%Fire
- 1,0108.5%Hazardous Condition
- 8226.9%Service Call
- 7766.6%Good Intent Call
- 4854.1%False Alarm
- 240.2%Severe Weather
- Fire incident types reported to NFIRS in Reading, OH
- 63159.6%Structure Fires
- 31029.3%Outside Fires
- 11310.7%Mobile Property/Vehicle Fires
- 40.4%Other
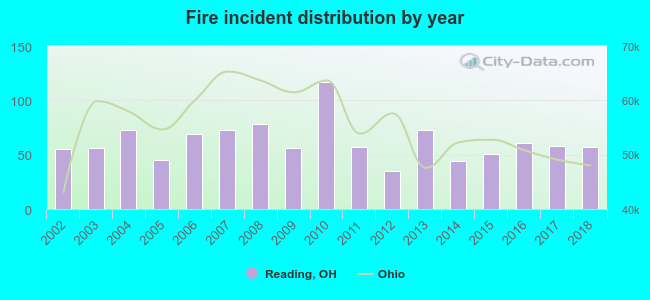 According to the data from the years 2002 - 2018 the average number of fire incidents per year is 62. The highest number of reported fires - 117 took place in 2010, and the least - 35 in 2012. The data has an increasing trend.
The average number of yearly fire incidents per 10k residents in Reading, OH compared to nearest cities:
(Note: Based on data for the last 3 years, including only cities with population 5,000 and above)
| Reading: | 56.7 |
| Wyoming: | 21.0 |
| Deer Park: | 26.9 |
| Blue Ash: | 53.8 |
| Norwood: | 47.8 |
| Madeira: | 11.9 |
| Sharonville: | 65.8 |
| Montgomery: | 22.3 |
| Springdale: | 78.8 |
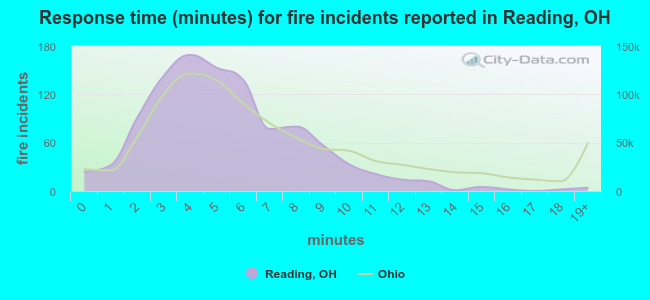 The median response time based on all reported fire incidents is 5 minutes. This is lower than the Ohio median value.
The median response time in Reading, OH compared to nearest cities:
(Note: Based on data for all years, including only cities with at least 500 fire incidents)
| Reading: | 5 minutes |
| Lockland: | 6 minutes |
| Lincoln Heights: | 5 minutes |
| Evendale: | 5 minutes |
| Wyoming: | 5 minutes |
| Woodlawn: | 5 minutes |
| Blue Ash: | 5 minutes |
| Norwood: | 3 minutes |
| Sharonville: | 6 minutes |
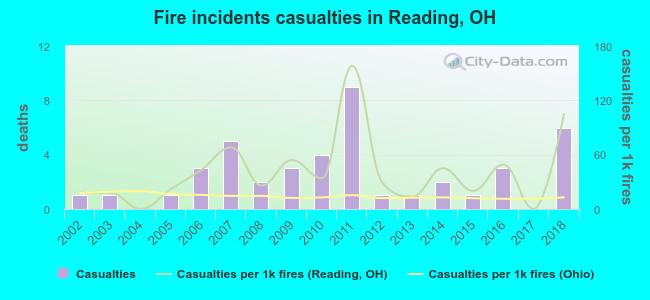 Based on the reports from the years 2002 - 2018 the average number of fire-related casualties per year is 3. The highest number of reported injuries - 9 took place in 2011, and the lowest - 0 in 2004. The data has an increasing trend.
The average number of casualties per 1,000 fire incidents is 41. This indicator was the highest - 158 in 2011, and the lowest 0 in 2004. The trend for casualties per 1,000 fires is growing. Compared to the Ohio value the number of casualties per 1,000 incidents is much higher.
Based on the reports from the years 2002 - 2018 the average number of fire-related casualties per year is 3. The highest number of reported injuries - 9 took place in 2011, and the lowest - 0 in 2004. The data has an increasing trend.
The average number of casualties per 1,000 fire incidents is 41. This indicator was the highest - 158 in 2011, and the lowest 0 in 2004. The trend for casualties per 1,000 fires is growing. Compared to the Ohio value the number of casualties per 1,000 incidents is much higher.Casualties per 1,000 incidents in Reading, OH compared to nearest cities:
(Note: Based on data for all years, including only cities with at least 500 fire incidents)
| Reading: | 40.6 |
| Lockland: | 11.9 |
| Lincoln Heights: | 0.0 |
| Evendale: | 3.7 |
| Wyoming: | 6.8 |
| Woodlawn: | 3.8 |
| Blue Ash: | 25.6 |
| Norwood: | 6.5 |
| Sharonville: | 6.8 |
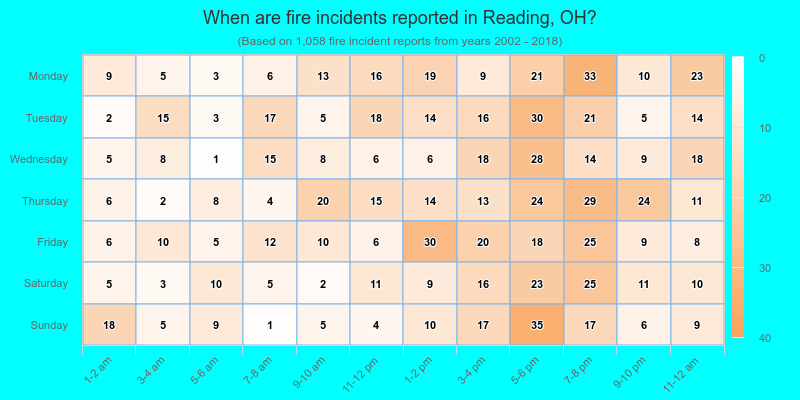
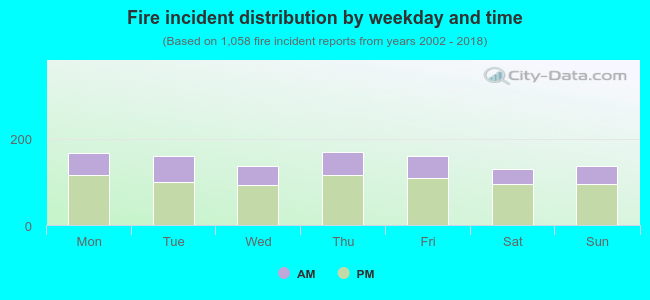 31.9% incidents where reported in the morning and 68.1% in the evening. The most fires (16.1%) took place on Thursday, and the least (12.3%) on Saturday.
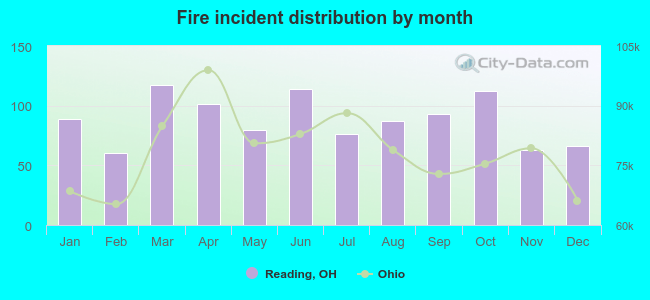 According to the 1,058 fire incidents from years 2002 - 2018 most fires (11.1%) took place during March, and the least (5.7%) in February.
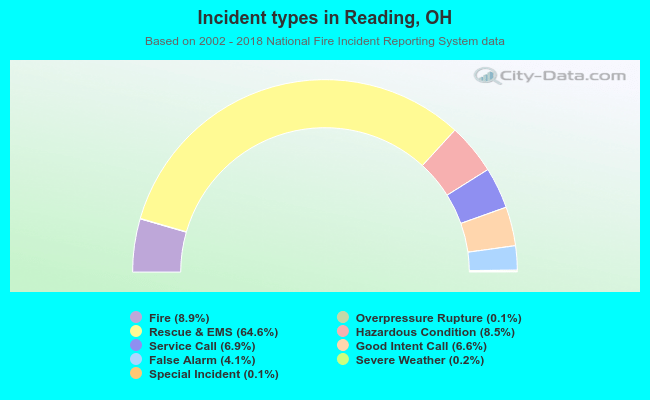 Out of all 11,843 cases reported during the years 2002 - 2018, the most belonged to the categories: Rescue & EMS (64.6%), Fire (8.9%), and Hazardous Condition (8.5%).
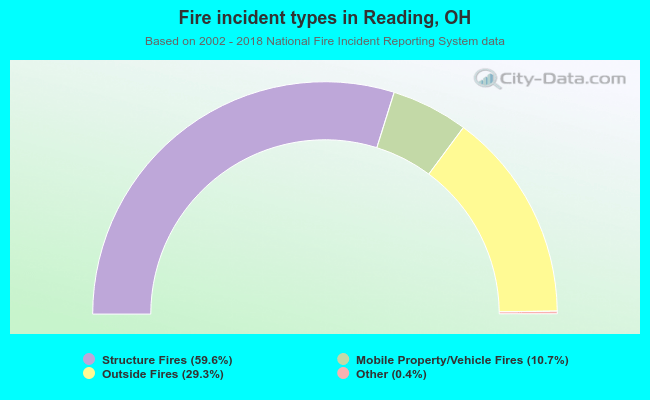 When looking into fire subcategories, the most incidents belonged to: Structure Fires (59.6%), and Outside Fires (29.3%).