Spring Hill: Fire Incidents, Tennessee (TN)
Where are fire incidents reported in Spring Hill, TN
Something went wrong! Please refresh the page.
|
| |||||||||||||||||||||||||||||||||||||||||||||||||||||||||||||||||||||||||||||||||||||||||||||||||||||||||||||
| Other | 49 | |||||||||||||||||||||||||||||||||||||||||||||||||||||||||||||||||||||||||||||||||||||||||||||||||||||||||||||
2002 - 2018 National Fire Incident Reporting System (NFIRS) incidents
- Incident types reported to NFIRS in Spring Hill, TN
- 3,89451.7%Rescue & EMS
- 92412.3%Hazardous Condition
- 83711.1%Fire
- 80010.6%False Alarm
- 6158.2%Service Call
- 4005.3%Good Intent Call
- 240.3%Overpressure Rupture
- 230.3%Special Incident
- 110.1%Severe Weather
- Fire incident types reported to NFIRS in Spring Hill, TN
- 39847.6%Outside Fires
- 24929.7%Structure Fires
- 17020.3%Mobile Property/Vehicle Fires
- 202.4%Other
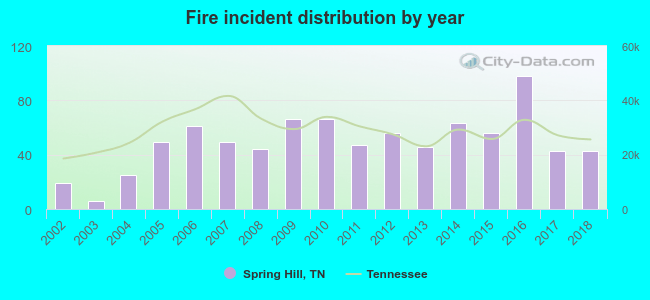 According to the data from the years 2002 - 2018 the average number of fires per year is 49. The highest number of fires - 98 took place in 2016, and the least - 6 in 2003. The data has an increasing trend.
The average number of yearly fire incidents per 10k residents in Spring Hill, TN compared to nearest cities:
(Note: Based on data for the last 3 years, including only cities with population 5,000 and above)
| Spring Hill: | 17.9 |
| Columbia: | 50.7 |
| Franklin: | 30.3 |
| Brentwood: | 22.5 |
| Nolensville: | 35.8 |
| Fairview: | 28.4 |
| Unionville: | 30.1 |
| Lewisburg: | 88.2 |
| La Vergne: | 1.8 |
 The median response time based on all reported fire incidents is 6 minutes. This is comparable to the Tennessee median value.
The median response time in Spring Hill, TN compared to nearest cities:
(Note: Based on data for all years, including only cities with at least 500 fire incidents)
| Spring Hill: | 6 minutes |
| Columbia: | 5 minutes |
| Franklin: | 6 minutes |
| Chapel Hill: | 8 minutes |
| Brentwood: | 6 minutes |
| Fairview: | 9 minutes |
| Lewisburg: | 6 minutes |
| La Vergne: | 3 minutes |
| Smyrna: | 6 minutes |
 25.8% incidents where reported in the morning and 74.2% in the evening. The most fires (16.6%) took place on Saturday, and the least (11.7%) on Tuesday.
 According to the 837 fire incidents from years 2002 - 2018 most fires (9.6%) took place during July, and the least (5.6%) in April.
 Out of all 7,528 cases reported during the years 2002 - 2018, the most belonged to the categories: Rescue & EMS (51.7%), Hazardous Condition (12.3%), and Fire (11.1%).
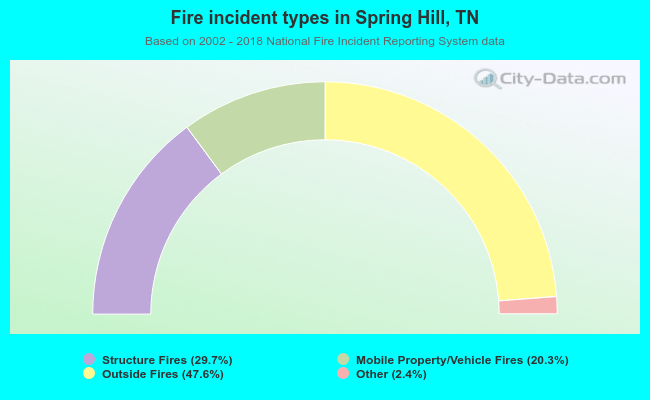 When looking into fire subcategories, the most reports belonged to: Outside Fires (47.6%), and Structure Fires (29.7%).