Spartanburg: Fire Incidents, South Carolina (SC)
Where are fire incidents reported in Spartanburg, SC
Something went wrong! Please refresh the page.
| Fire incidents reported | |
|---|---|
| Sreet name | Count |
| MAIN ST | 812 |
| CHURCH ST | 622 |
| BLACKSTOCK RD | 480 |
| HOWARD ST | 340 |
| PINE ST | 272 |
| JOHN B WHITE SR BLVD | 266 |
| SOUTHPORT RD | 254 |
| ASHEVILLE HWY | 246 |
| FERNWOOD GLENDALE RD | 196 |
| UNION ST | 140 |
| POWELL MILL RD | 136 |
| PRINCE HALL LN | 132 |
| KENSINGTON DR | 128 |
| NORRIS ST | 126 |
| ABNER RD | 124 |
| HIGHLAND AVE | 124 |
| FOREST ST | 116 |
| COLLINS AVE | 110 |
| FAIRFOREST RD | 108 |
| DORMAN CENTRE DR | 106 |
| MAGNOLIA ST | 98 |
| HAYNE ST | 96 |
| INTERSTATE 85 | 96 |
| WOOD ST | 96 |
| CEDAR SPRINGS RD | 94 |
| INTERSTATE 85 HWY | 90 |
| SKYLYN DR | 88 |
| DANIEL MORGAN AVE | 84 |
| CHESNEE HWY | 80 |
| LIBERTY ST | 80 |
| Other | 4,730 |
2002 - 2018 National Fire Incident Reporting System (NFIRS) incidents
- Incident types reported to NFIRS in Spartanburg, SC
- 12,33929.1%Rescue & EMS
- 10,47024.7%Fire
- 6,36715.0%Hazardous Condition
- 6,13014.4%False Alarm
- 4,71811.1%Good Intent Call
- 1,8934.5%Service Call
- 2400.6%Overpressure Rupture
- 2260.5%Special Incident
- 450.1%Severe Weather
- Fire incident types reported to NFIRS in Spartanburg, SC
- 5,38151.4%Structure Fires
- 3,37232.2%Outside Fires
- 1,39913.4%Mobile Property/Vehicle Fires
- 3183.0%Other
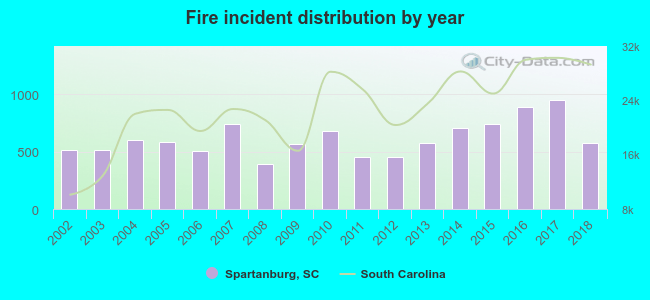 Based on the data from the years 2002 - 2018 the average number of fire incidents per year is 616. The highest number of fire incidents - 948 took place in 2017, and the least - 396 in 2008. The data has a growing trend.
The average number of yearly fire incidents per 10k residents in Spartanburg, SC compared to nearest cities:
(Note: Based on data for the last 3 years, including only cities with population 5,000 and above)
| Spartanburg: | 214.9 |
| Valley Falls: | 1.6 |
| Boiling Springs: | 124.5 |
| Pauline: | 25.2 |
| Macedonia: | 2.0 |
| Fingerville: | 4.2 |
| Gramling: | 1.6 |
| Greer: | 107.6 |
| Gaffney: | 158.0 |
 The median response time based on all reported fire incidents is 6 minutes. This is similar to the state median value.
The median response time in Spartanburg, SC compared to nearest cities:
(Note: Based on data for all years, including only cities with at least 500 fire incidents)
| Spartanburg: | 6 minutes |
| Roebuck: | 7 minutes |
| Boiling Springs: | 7 minutes |
| Cowpens: | 8 minutes |
| Wellford: | 7 minutes |
| Lyman: | 5 minutes |
| Inman: | 7 minutes |
| Duncan: | 6 minutes |
| Chesnee: | 9 minutes |
 According to the data from the years 2002 - 2018 the average number of fire-related yearly deaths is 1. The highest number of reported deaths - 3 took place in 2005, and the lowest - 0 in 2003. The data has a dropping trend.
The average number of deaths per 1,000 fires is 2. This indicator was the highest - 5 in 2005, and the lowest 0 in 2003. The trend for deaths per 1,000 incidents is declining. Compared to the state value the number of fatalities per 1,000 fire incidents is about the same.
According to the data from the years 2002 - 2018 the average number of fire-related yearly deaths is 1. The highest number of reported deaths - 3 took place in 2005, and the lowest - 0 in 2003. The data has a dropping trend.
The average number of deaths per 1,000 fires is 2. This indicator was the highest - 5 in 2005, and the lowest 0 in 2003. The trend for deaths per 1,000 incidents is declining. Compared to the state value the number of fatalities per 1,000 fire incidents is about the same.Deaths per 1,000 incidents in Spartanburg, SC compared to nearest cities:
(Note: Based on data for all years, including only cities with at least 2,500 fire incidents)
| Spartanburg: | 2.0 |
| Greer: | 3.9 |
| Gaffney: | 3.4 |
| Greenville: | 1.8 |
 Based on the reports from the years 2002 - 2018 the average number of fire-related casualties per year is 2. The highest number of reported casualties - 11 took place in 2017, and the lowest - 0 in 2003. The data has a constant trend.
The average number of casualties per 1,000 fire incidents is 4. This indicator was the highest - 12 in 2017, and the lowest 0 in 2003. The trend for injuries per 1,000 fire incidents is declining. Compared to the South Carolina value the number of injuries per 1,000 fire incidents is lower.
Based on the reports from the years 2002 - 2018 the average number of fire-related casualties per year is 2. The highest number of reported casualties - 11 took place in 2017, and the lowest - 0 in 2003. The data has a constant trend.
The average number of casualties per 1,000 fire incidents is 4. This indicator was the highest - 12 in 2017, and the lowest 0 in 2003. The trend for injuries per 1,000 fire incidents is declining. Compared to the South Carolina value the number of injuries per 1,000 fire incidents is lower.
 30.6% incidents where reported in the morning and 69.4% in the evening. The most fires (15.2%) took place on Saturday, and the least (13.4%) on Sunday.
 Based on the 10,470 incident reports from years 2002 - 2018 most fires (10.8%) took place during July, and the least (6.8%) in October.
 Out of all 42,428 cases reported during the years 2002 - 2018, the most belonged to the categories: Rescue & EMS (29.1%), Fire (24.7%), and Hazardous Condition (15.0%).
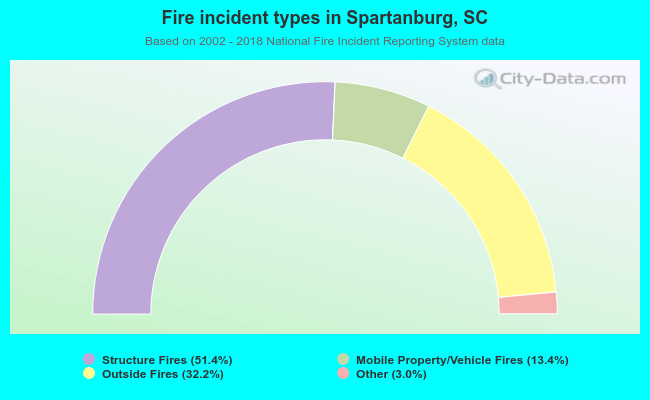 When looking into fire subcategories, the most reports belonged to: Structure Fires (51.4%), and Outside Fires (32.2%).