Gaffney: Fire Incidents, South Carolina (SC)
Where are fire incidents reported in Gaffney, SC
Something went wrong! Please refresh the page.
| Fire incidents reported | |
|---|---|
| Sreet name | Count |
| FLOYD BAKER BLVD | 184 |
| LIMESTONE ST | 140 |
| CHESNEE HWY | 128 |
| CHEROKEE AVE | 122 |
| UNION HWY | 98 |
| WILKINSVILLE HWY | 98 |
| GREEN RIVER RD | 84 |
| BUCK SHOALS RD | 80 |
| HYATT ST | 68 |
| WILCOX AVE | 66 |
| BONNER RD | 56 |
| GRANARD ST | 54 |
| PACOLET HWY | 52 |
| BUFORD ST | 48 |
| JR HIGH RD | 48 |
| SHELBY HWY | 48 |
| I-85 | 46 |
| FREDERICK ST | 44 |
| LOGAN ST | 44 |
| BURNT GIN RD | 42 |
| LOCKHART LN | 42 |
| MARIETTA RD | 42 |
| OLD GEORGIA HWY | 42 |
| RIVER DR | 40 |
| 4TH ST | 38 |
| RUTLEDGE AVE | 38 |
| HETTY HILL ST | 36 |
| OLD POST RD | 36 |
| OVERBROOK DR | 36 |
| FORD RD | 34 |
| Other | 1,869 |
2003 - 2018 National Fire Incident Reporting System (NFIRS) incidents
- Incident types reported to NFIRS in Gaffney, SC
- 5,85642.5%Rescue & EMS
- 3,80327.6%Fire
- 1,3009.4%Hazardous Condition
- 1,2689.2%Good Intent Call
- 9156.6%False Alarm
- 5133.7%Service Call
- 960.7%Severe Weather
- 260.2%Overpressure Rupture
- Fire incident types reported to NFIRS in Gaffney, SC
- 1,65743.6%Structure Fires
- 1,32434.8%Outside Fires
- 55114.5%Mobile Property/Vehicle Fires
- 2717.1%Other
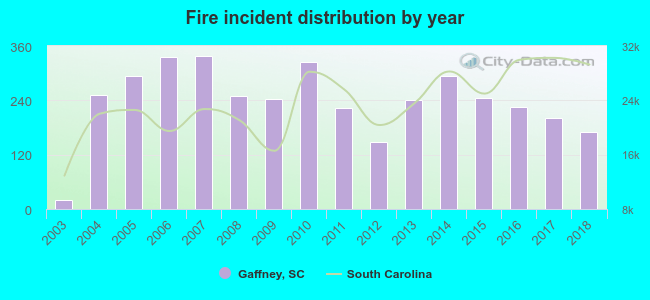 According to the data from the years 2003 - 2018 the average number of fires per year is 238. The highest number of fire incidents - 338 took place in 2007, and the least - 19 in 2003. The data has an increasing trend.
The average number of yearly fire incidents per 10k residents in Gaffney, SC compared to nearest cities:
(Note: Based on data for the last 3 years, including only cities with population 5,000 and above)
| Gaffney: | 158.0 |
| Macedonia: | 2.0 |
| Spartanburg: | 214.9 |
| Boiling Springs: | 124.5 |
| Valley Falls: | 1.6 |
| Pauline: | 25.2 |
| Fingerville: | 4.2 |
| York: | 138.1 |
| Clover: | 131.4 |
 The median response time based on all reported fire incidents is 6 minutes. This is about the same as the state median value.
The median response time in Gaffney, SC compared to nearest cities:
(Note: Based on data for all years, including only cities with at least 500 fire incidents)
| Gaffney: | 6 minutes |
| Blacksburg: | 6 minutes |
| Cowpens: | 8 minutes |
| Chesnee: | 9 minutes |
| Grover: | 7 minutes |
| Mooresboro: | 9 minutes |
| Shelby: | 8 minutes |
| Spartanburg: | 6 minutes |
| Boiling Springs: | 7 minutes |
 According to the reports from the years 2003 - 2018 the average number of fire-related fatalities per year is 1. The highest number of deaths - 4 took place in 2014, and the lowest - 0 in 2003. The data has an increasing trend.
The average number of deaths per 1,000 fires is 3. This indicator was the highest - 14 in 2014, and the lowest 0 in 2003. The trend for deaths per 1,000 fires is growing. Compared to the South Carolina value the number of deaths per 1,000 fire incidents is higher.
According to the reports from the years 2003 - 2018 the average number of fire-related fatalities per year is 1. The highest number of deaths - 4 took place in 2014, and the lowest - 0 in 2003. The data has an increasing trend.
The average number of deaths per 1,000 fires is 3. This indicator was the highest - 14 in 2014, and the lowest 0 in 2003. The trend for deaths per 1,000 fires is growing. Compared to the South Carolina value the number of deaths per 1,000 fire incidents is higher.Deaths per 1,000 incidents in Gaffney, SC compared to nearest cities:
(Note: Based on data for all years, including only cities with at least 2,500 fire incidents)
| Gaffney: | 3.4 |
| Shelby: | 1.1 |
| Spartanburg: | 2.0 |
| Gastonia: | 3.0 |
 Based on the data from the years 2003 - 2018 the average number of fire-related casualties per year is 1. The highest number of injuries - 5 took place in 2014, and the lowest - 0 in 2003. The data has a rising trend.
The average number of injuries per 1,000 fire incidents is 3. This indicator was the highest - 17 in 2014, and the lowest 0 in 2003. The trend for injuries per 1,000 incidents is rising. Compared to the South Carolina value the number of casualties per 1,000 fire incidents is much lower.
Based on the data from the years 2003 - 2018 the average number of fire-related casualties per year is 1. The highest number of injuries - 5 took place in 2014, and the lowest - 0 in 2003. The data has a rising trend.
The average number of injuries per 1,000 fire incidents is 3. This indicator was the highest - 17 in 2014, and the lowest 0 in 2003. The trend for injuries per 1,000 incidents is rising. Compared to the South Carolina value the number of casualties per 1,000 fire incidents is much lower.Casualties per 1,000 incidents in Gaffney, SC compared to nearest cities:
(Note: Based on data for all years, including only cities with at least 500 fire incidents)
| Gaffney: | 3.2 |
| Blacksburg: | 0.0 |
| Cowpens: | 0.8 |
| Chesnee: | 5.6 |
| Grover: | 0.0 |
| Mooresboro: | 0.0 |
| Shelby: | 0.3 |
| Spartanburg: | 3.9 |
| Boiling Springs: | 7.9 |
 30.6% incidents where reported in the morning and 69.4% in the evening. The most fires (15.8%) took place on Saturday, and the least (13.7%) on Wednesday.
 According to the 3,803 fire incidents from years 2003 - 2018 most fires (11.6%) took place during March, and the least (6.6%) in October.
 Out of all 13,790 cases reported during the years 2003 - 2018, the most belonged to the categories: Rescue & EMS (42.5%), Fire (27.6%), and Hazardous Condition (9.4%).
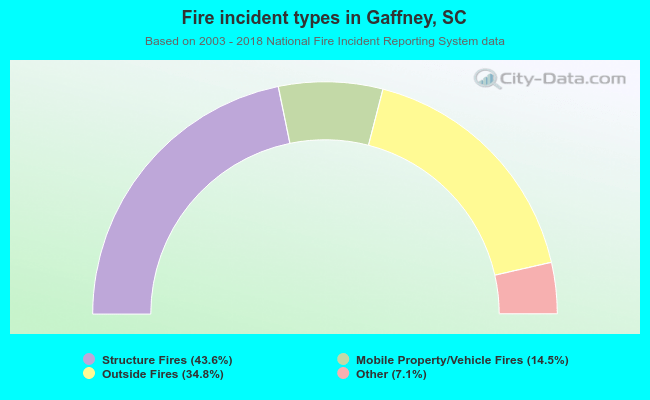 When looking into fire subcategories, the most incidents belonged to: Structure Fires (43.6%), and Outside Fires (34.8%).