Searcy: Fire Incidents, Arkansas (AR)
Where are fire incidents reported in Searcy, AR
Something went wrong! Please refresh the page.
| Fire incidents reported | |
|---|---|
| Sreet name | Count |
| RACE | 162 |
| RACE AVE | 136 |
| HWY 36 | 80 |
| MAIN ST | 76 |
| MAIN | 72 |
| COUNTRY CLUB RD | 64 |
| HWY 67167 | 64 |
| MOORE | 64 |
| FOSTER CHAPEL RD | 60 |
| RACE ST | 60 |
| BEEBECAPPS EXPY | 56 |
| FAIRVIEW RD | 56 |
| MOORE AVE | 54 |
| HOLMES RD | 50 |
| BOOTH RD | 48 |
| CROSBY RD | 46 |
| BENTON | 44 |
| HIGHWAY 267 | 44 |
| MORRIS SCHOOL RD | 44 |
| PLEASURE AVE | 44 |
| HWY 16 | 38 |
| 367 HWY | 36 |
| BLOODWORTH RD | 36 |
| BOOTH | 36 |
| MEADOW LAKE CIR | 36 |
| 67/167 HWY | 34 |
| BEEBE-CAPPS | 32 |
| EASTLINE RD | 32 |
| MARKET | 32 |
| YERBY RD | 32 |
| Other | 1,462 |
2002 - 2018 National Fire Incident Reporting System (NFIRS) incidents
- Incident types reported to NFIRS in Searcy, AR
- 3,28229.1%Rescue & EMS
- 3,13027.7%Fire
- 1,56413.9%Service Call
- 1,44612.8%False Alarm
- 1,14110.1%Hazardous Condition
- 6205.5%Good Intent Call
- 460.4%Overpressure Rupture
- 410.4%Severe Weather
- Fire incident types reported to NFIRS in Searcy, AR
- 1,61951.7%Outside Fires
- 93830.0%Structure Fires
- 48515.5%Mobile Property/Vehicle Fires
- 882.8%Other
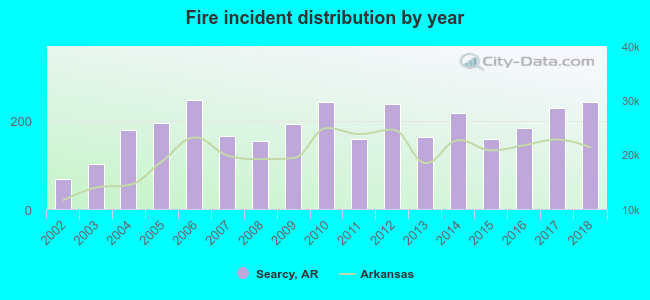 According to the data from the years 2002 - 2018 the average number of fires per year is 184. The highest number of fires - 246 took place in 2006, and the least - 68 in 2002. The data has a rising trend.
The average number of yearly fire incidents per 10k residents in Searcy, AR compared to nearest cities:
(Note: Based on data for the last 3 years, including only cities with population 5,000 and above)
| Searcy: | 91.0 |
| Beebe: | 171.0 |
| Heber Springs: | 90.1 |
| Cabot: | 64.8 |
| Jacksonville: | 71.7 |
| Newport: | 88.7 |
| Batesville: | 186.1 |
| Greenbrier: | 210.4 |
| Sherwood: | 68.3 |
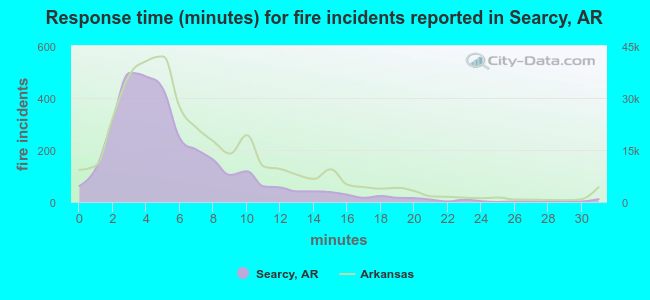 The median response time based on all reported fire incidents is 5 minutes. This is lower than the Arkansas median value.
The median response time in Searcy, AR compared to nearest cities:
(Note: Based on data for all years, including only cities with at least 500 fire incidents)
| Searcy: | 5 minutes |
| Bald Knob: | 8 minutes |
| McRae: | 8 minutes |
| Beebe: | 5 minutes |
| Bradford: | 7 minutes |
| Ward: | 7 minutes |
| Rose Bud: | 2 minutes |
| Augusta: | 5 minutes |
| Austin: | 7 minutes |
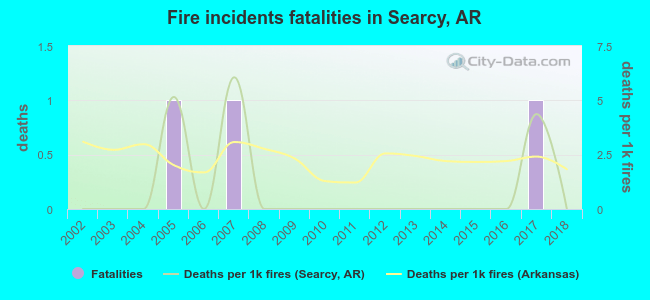 Based on the reports from the years 2002 - 2018 the average number of fire-related yearly deaths is 0. The highest number of deaths - 1 took place in 2005, and the lowest - 0 in 2002. The data has a constant trend.
The average number of deaths per 1,000 fires is 1. This indicator was the highest - 6 in 2007, and the lowest 0 in 2002. The trend for fatalities per 1,000 fires is constant. Compared to the state value the number of fatalities per 1,000 fires is much lower.
Based on the reports from the years 2002 - 2018 the average number of fire-related yearly deaths is 0. The highest number of deaths - 1 took place in 2005, and the lowest - 0 in 2002. The data has a constant trend.
The average number of deaths per 1,000 fires is 1. This indicator was the highest - 6 in 2007, and the lowest 0 in 2002. The trend for fatalities per 1,000 fires is constant. Compared to the state value the number of fatalities per 1,000 fires is much lower.Deaths per 1,000 incidents in Searcy, AR compared to nearest cities:
(Note: Based on data for all years, including only cities with at least 2,500 fire incidents)
| Searcy: | 1.0 |
| Cabot: | 1.1 |
| Jacksonville: | 1.6 |
| Batesville: | 0.6 |
| Sherwood: | 0.7 |
| Conway: | 2.7 |
| North Little Rock: | 2.3 |
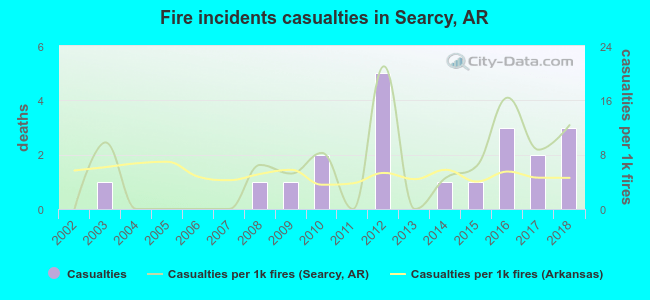 Based on the data from the years 2002 - 2018 the average number of fire-related casualties per year is 1. The highest number of injuries - 5 took place in 2012, and the lowest - 0 in 2002. The data has an increasing trend.
The average number of injuries per 1,000 fires is 6. This indicator was the highest - 21 in 2012, and the lowest 0 in 2002. The trend for injuries per 1,000 fire incidents is growing. Compared to the state value the number of casualties per 1,000 fire incidents is higher.
Based on the data from the years 2002 - 2018 the average number of fire-related casualties per year is 1. The highest number of injuries - 5 took place in 2012, and the lowest - 0 in 2002. The data has an increasing trend.
The average number of injuries per 1,000 fires is 6. This indicator was the highest - 21 in 2012, and the lowest 0 in 2002. The trend for injuries per 1,000 fire incidents is growing. Compared to the state value the number of casualties per 1,000 fire incidents is higher.
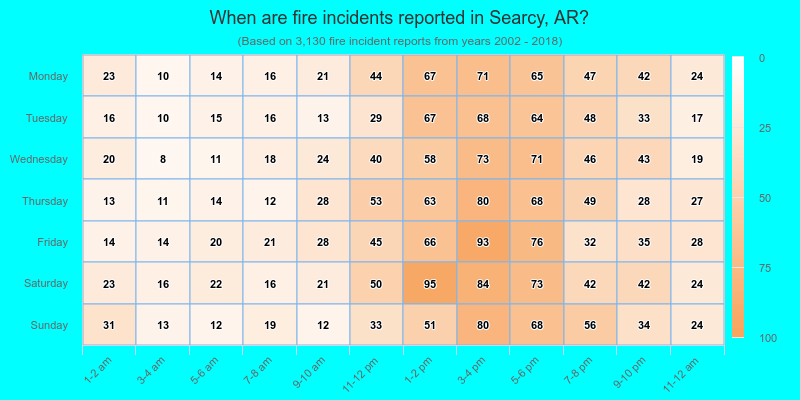
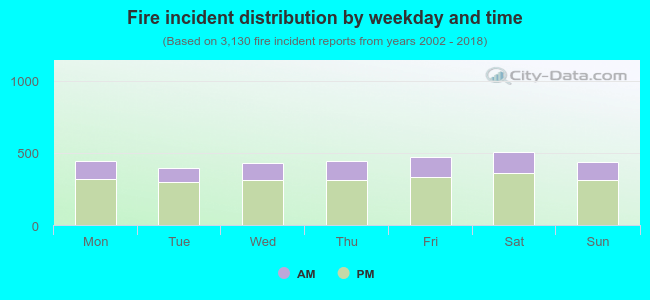 28.4% incidents where reported in the morning and 71.6% in the evening. The most fires (16.2%) took place on Saturday, and the least (12.7%) on Tuesday.
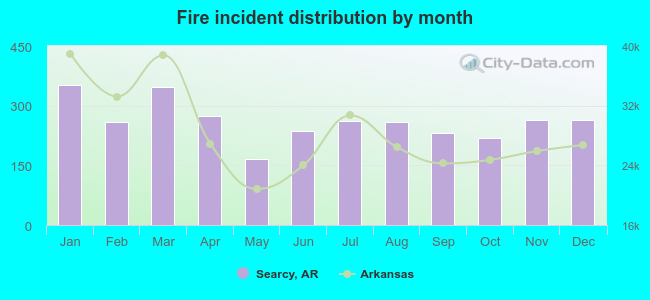 Based on the 3,130 fire incidents from years 2002 - 2018 most fires (11.2%) took place during January, and the least (5.3%) in May.
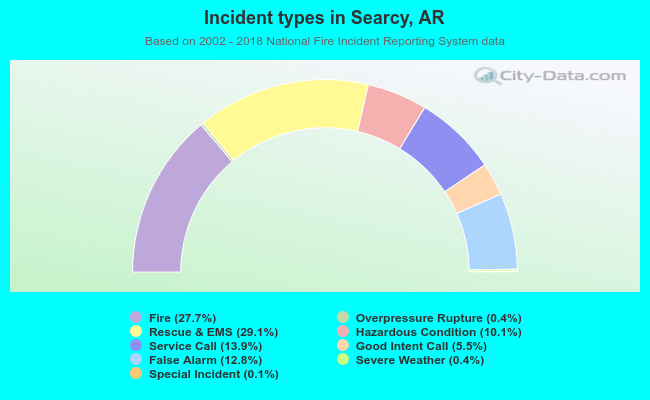 Out of all 11,281 cases reported during the years 2002 - 2018, the most belonged to the categories: Rescue & EMS (29.1%), Fire (27.7%), and Service Call (13.9%).
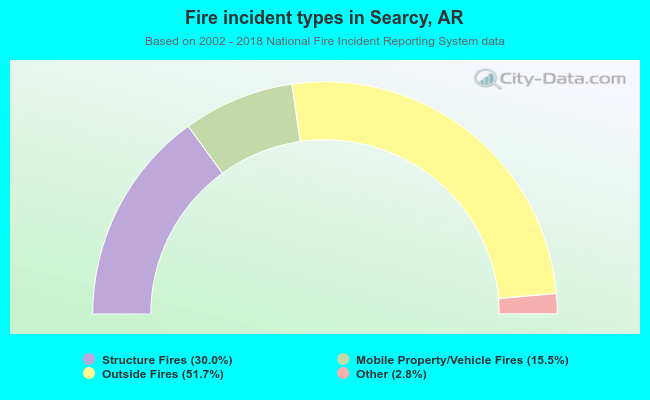 When looking into fire subcategories, the most reports belonged to: Outside Fires (51.7%), and Structure Fires (30.0%).