Jacksonville: Fire Incidents, Arkansas (AR)
Where are fire incidents reported in Jacksonville, AR
Something went wrong! Please refresh the page.
| Fire incidents reported | |
|---|---|
| Sreet name | Count |
| MADDOX RD | 168 |
| JOHN HARDEN DR | 158 |
| MAIN ST | 152 |
| FIRST ST | 144 |
| 1 ST | 122 |
| PETERS RD | 102 |
| REDMOND RD | 96 |
| MARSHALL RD | 94 |
| REPUBLICAN RD | 94 |
| BATESVILLE PIKE | 92 |
| HWY 107 | 88 |
| MILITARY RD | 88 |
| JACKSONVILLE CONWAY RD | 74 |
| 67/167 HWY | 70 |
| GRAHAM RD | 68 |
| VALENTINE RD | 66 |
| HOSPITAL BLVD | 62 |
| FORTSON RD | 60 |
| JAMES ST | 58 |
| CENTENNIAL RD | 54 |
| COFFELT RD | 50 |
| OLD TOM BOX RD | 50 |
| ROOSEVELT RD | 48 |
| J P WRIGHT LOOP RD | 42 |
| T P WHITE RD | 42 |
| BRADEN ST | 40 |
| REPUBLICAN | 40 |
| POPLAR ST | 38 |
| STONEWALL DR | 38 |
| HIGHWAY 107 | 36 |
| Other | 1,387 |
2002 - 2018 National Fire Incident Reporting System (NFIRS) incidents
- Incident types reported to NFIRS in Jacksonville, AR
- 18,80164.0%Rescue & EMS
- 3,72112.7%Fire
- 2,3277.9%Service Call
- 1,6885.7%Hazardous Condition
- 1,4244.8%False Alarm
- 1,2814.4%Good Intent Call
- 710.2%Special Incident
- 370.1%Severe Weather
- 300.1%Overpressure Rupture
- Fire incident types reported to NFIRS in Jacksonville, AR
- 1,64844.3%Outside Fires
- 1,41738.1%Structure Fires
- 53014.2%Mobile Property/Vehicle Fires
- 1263.4%Other
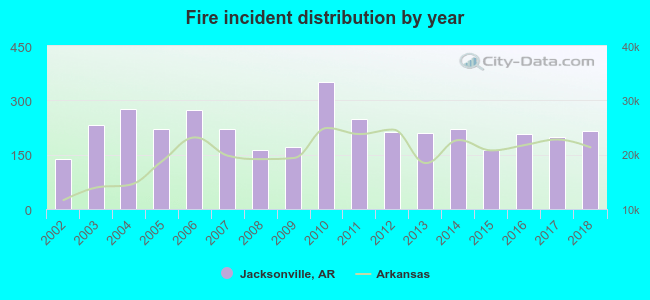 Based on the data from the years 2002 - 2018 the average number of fires per year is 219. The highest number of fire incidents - 350 took place in 2010, and the least - 139 in 2002. The data has a rising trend.
The average number of yearly fire incidents per 10k residents in Jacksonville, AR compared to nearest cities:
(Note: Based on data for the last 3 years, including only cities with population 5,000 and above)
| Jacksonville: | 71.7 |
| Sherwood: | 68.3 |
| Cabot: | 64.8 |
| North Little Rock: | 87.9 |
| Little Rock: | 80.1 |
| Maumelle: | 23.6 |
| Beebe: | 171.0 |
| Conway: | 51.4 |
| East End: | 1.4 |
 The median response time based on all reported fire incidents is 5 minutes. This is lower compared to the state median value.
The median response time in Jacksonville, AR compared to nearest cities:
(Note: Based on data for all years, including only cities with at least 500 fire incidents)
| Jacksonville: | 5 minutes |
| Sherwood: | 4 minutes |
| Cabot: | 6 minutes |
| North Little Rock: | 5 minutes |
| Austin: | 7 minutes |
| Scott: | 9 minutes |
| Lonoke: | 9 minutes |
| Ward: | 7 minutes |
| Vilonia: | 6 minutes |
 Based on the reports from the years 2002 - 2018 the average number of fire-related yearly deaths is 0. The highest number of deaths - 2 took place in 2002, and the lowest - 0 in 2004. The data has a decreasing trend.
The average number of fatalities per 1,000 fire incidents is 2. This indicator was the highest - 14 in 2002, and the lowest 0 in 2004. The trend for fatalities per 1,000 fires is decreasing. Compared to the state value the number of deaths per 1,000 fires is lower.
Based on the reports from the years 2002 - 2018 the average number of fire-related yearly deaths is 0. The highest number of deaths - 2 took place in 2002, and the lowest - 0 in 2004. The data has a decreasing trend.
The average number of fatalities per 1,000 fire incidents is 2. This indicator was the highest - 14 in 2002, and the lowest 0 in 2004. The trend for fatalities per 1,000 fires is decreasing. Compared to the state value the number of deaths per 1,000 fires is lower.Deaths per 1,000 incidents in Jacksonville, AR compared to nearest cities:
(Note: Based on data for all years, including only cities with at least 2,500 fire incidents)
| Jacksonville: | 1.6 |
| Sherwood: | 0.7 |
| Cabot: | 1.1 |
| North Little Rock: | 2.3 |
| Little Rock: | 1.4 |
| Conway: | 2.7 |
| Benton: | 1.2 |
| Searcy: | 1.0 |
 Based on the reports from the years 2002 - 2018 the average number of fire-related yearly casualties is 2. The highest number of casualties - 6 took place in 2003, and the lowest - 0 in 2002. The data has a rising trend.
The average number of injuries per 1,000 fires is 8. This indicator was the highest - 26 in 2003, and the lowest 0 in 2002. The trend for casualties per 1,000 fires is growing. Compared to the Arkansas value the number of injuries per 1,000 fires is higher.
Based on the reports from the years 2002 - 2018 the average number of fire-related yearly casualties is 2. The highest number of casualties - 6 took place in 2003, and the lowest - 0 in 2002. The data has a rising trend.
The average number of injuries per 1,000 fires is 8. This indicator was the highest - 26 in 2003, and the lowest 0 in 2002. The trend for casualties per 1,000 fires is growing. Compared to the Arkansas value the number of injuries per 1,000 fires is higher.
 27.9% incidents where reported in the morning and 72.1% in the evening. The most fires (14.8%) took place on Saturday, and the least (14.1%) on Sunday.
 According to the 3,721 fire incidents from years 2002 - 2018 most fires (11.0%) took place during March, and the least (6.5%) in May.
 Out of all 29,380 cases reported during the years 2002 - 2018, the most belonged to the categories: Rescue & EMS (64.0%), Fire (12.7%), and Service Call (7.9%).
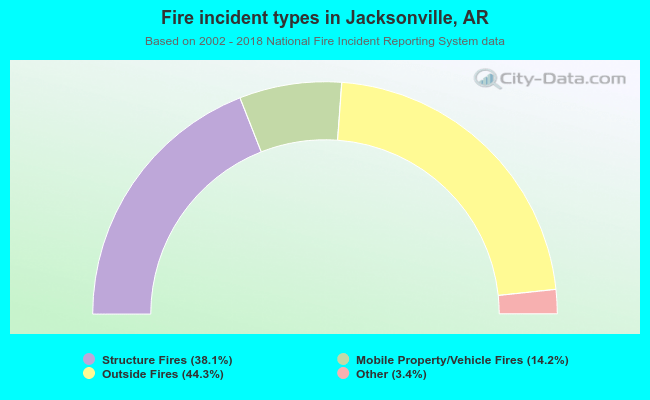 When looking into fire subcategories, the most reports belonged to: Outside Fires (44.3%), and Structure Fires (38.1%).