Scotia: Fire Incidents, New York (NY)
Where are fire incidents reported in Scotia, NY
Something went wrong! Please refresh the page.
|
| |||||||||||||||||||||||||||||||||||||||||||||||||||||||||||||||||||||||||||||||||||||||||||||||||||||||||||||
2002 - 2018 National Fire Incident Reporting System (NFIRS) incidents
- Incident types reported to NFIRS in Scotia, NY
- 5,51555.0%Rescue & EMS
- 1,21612.1%Hazardous Condition
- 1,21112.1%Service Call
- 1,12111.2%False Alarm
- 4654.6%Good Intent Call
- 4594.6%Fire
- 160.2%Special Incident
- 150.1%Severe Weather
- 140.1%Overpressure Rupture
- Fire incident types reported to NFIRS in Scotia, NY
- 27058.8%Structure Fires
- 9220.0%Outside Fires
- 4910.7%Mobile Property/Vehicle Fires
- 4810.5%Other
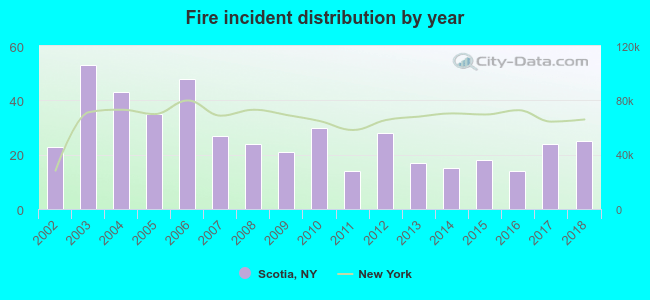 Based on the data from the years 2002 - 2018 the average number of fire incidents per year is 27. The highest number of reported fire incidents - 53 took place in 2003, and the least - 14 in 2011. The data has a growing trend.
The average number of yearly fire incidents per 10k residents in Scotia, NY compared to nearest cities:
(Note: Based on data for the last 3 years, including only cities with population 5,000 and above)
| Scotia: | 26.9 |
| Glenville: | 67.6 |
| Schenectady: | 72.1 |
| Rotterdam: | 1.0 |
| East Glenville: | 1.5 |
| Clifton Park: | 34.1 |
| Guilderland: | 7.3 |
| Colonie: | 120.5 |
| Halfmoon: | 15.6 |
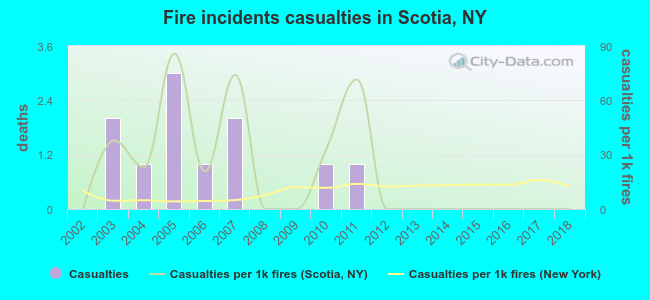 According to the reports from the years 2002 - 2018 the average number of fire-related casualties per year is 1. The highest number of casualties - 3 took place in 2005, and the lowest - 0 in 2002. The data has a constant trend.
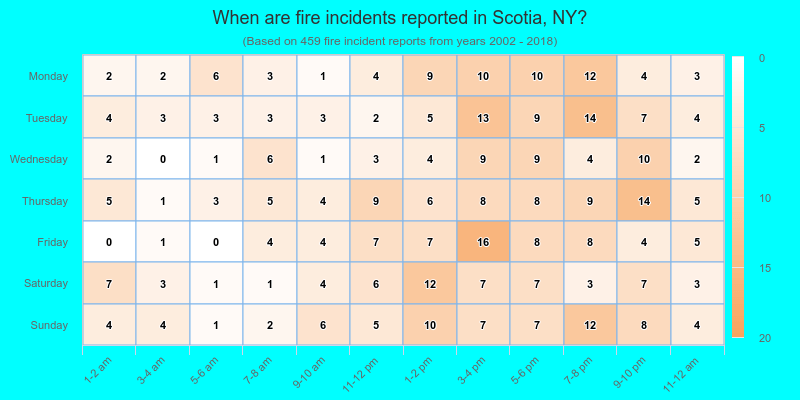
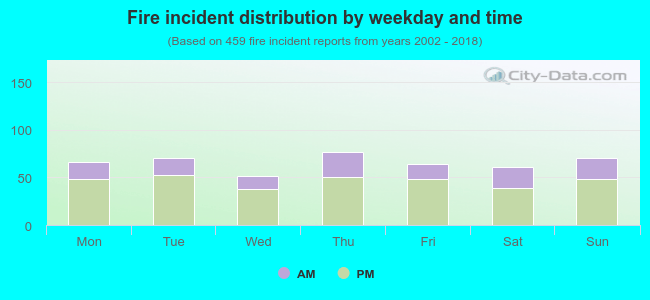 29.6% incidents where reported in the morning and 70.4% in the evening. The most fires (16.8%) took place on Thursday, and the least (11.1%) on Wednesday.
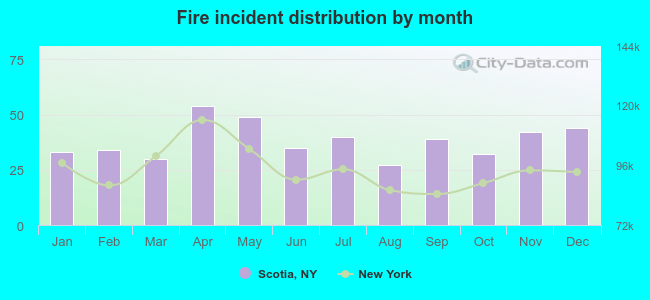 According to the 459 fire incident reports from years 2002 - 2018 most fires (11.8%) took place during April, and the least (5.9%) in August.
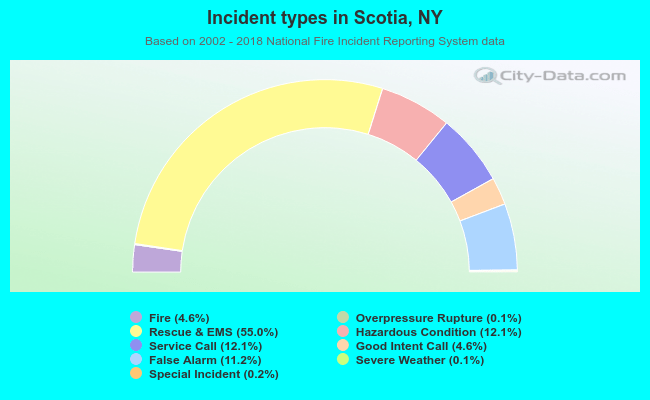 Out of all 10,032 cases reported during the years 2002 - 2018, the most belonged to the categories: Rescue & EMS (55.0%), Hazardous Condition (12.1%), and Service Call (12.1%).
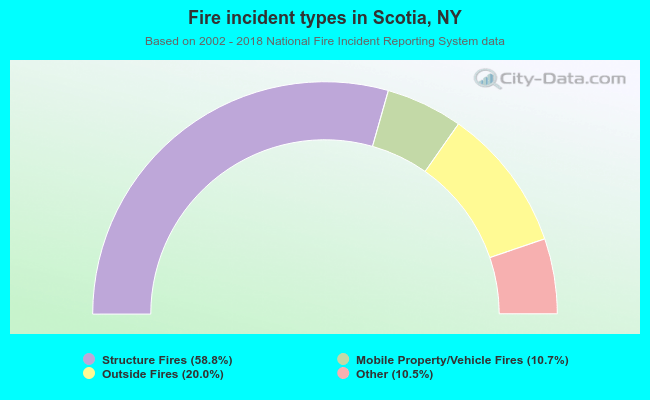 When looking into fire subcategories, the most incidents belonged to: Structure Fires (58.8%), and Outside Fires (20.0%).