Clifton Park: Fire Incidents, New York (NY)
Where are fire incidents reported in Clifton Park, NY
Something went wrong! Please refresh the page.
| Fire incidents reported | |
|---|---|
| Sreet name | Count |
| ROUTE 9 | 174 |
| ROUTE 146 | 140 |
| CLIFTON COUNTRY ROAD | 76 |
| CRESCENT ROAD | 58 |
| PLANK ROAD | 40 |
| BEACH ROAD | 38 |
| FOXWOOD DR | 32 |
| CRESCENT RD | 30 |
| CLIFTON PARK CENTER ROAD | 26 |
| GROOMS RD | 26 |
| KATHERINE DRIVE | 26 |
| GROOMS RD | 24 |
| MAIN ST | 24 |
| PLANK RD | 24 |
| USHERS RD | 24 |
| WOODIN ROAD | 24 |
| PIERCE RD | 22 |
| ROUTE 146A | 22 |
| WALL STREET | 18 |
| CLIFTON COUNTRY RD | 16 |
| GROOMS ROAD | 16 |
| HALFMOON CIRCLE | 16 |
| RIVERVIEW RD | 16 |
| WAITE RD | 16 |
| BEACH RD | 14 |
| CANAL ROAD | 14 |
| CLAMSTEAM ROAD | 14 |
| DEER RUN HOLLOW | 14 |
| DUNSBACH RD | 14 |
| FOXWOOD DR | 14 |
| Other | 1,070 |
2002 - 2018 National Fire Incident Reporting System (NFIRS) incidents
- Incident types reported to NFIRS in Clifton Park, NY
- 3,77226.9%Rescue & EMS
- 2,61118.6%Hazardous Condition
- 2,34016.7%Good Intent Call
- 2,08214.9%Fire
- 2,04214.6%False Alarm
- 1,1288.1%Service Call
- Fire incident types reported to NFIRS in Clifton Park, NY
- 1,31963.4%Structure Fires
- 42220.3%Outside Fires
- 26212.6%Mobile Property/Vehicle Fires
- 793.8%Other
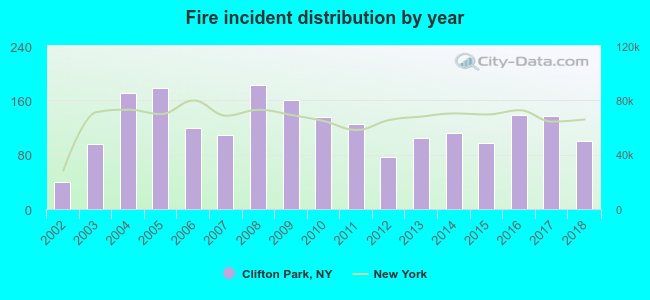 According to the data from the years 2002 - 2018 the average number of fire incidents per year is 122. The highest number of fires - 182 took place in 2008, and the least - 40 in 2002. The data has a growing trend.
The average number of yearly fire incidents per 10k residents in Clifton Park, NY compared to nearest cities:
(Note: Based on data for the last 3 years, including only cities with population 5,000 and above)
| Clifton Park: | 34.1 |
| Halfmoon: | 15.6 |
| East Glenville: | 1.5 |
| Malta: | 29.1 |
| Mechanicville: | 55.4 |
| Schenectady: | 72.1 |
| Glenville: | 67.6 |
| Scotia: | 26.9 |
| Cohoes: | 42.8 |
 The median response time based on all reported fire incidents is 6 minutes. This is higher than the New York median value.
The median response time in Clifton Park, NY compared to nearest cities:
(Note: Based on data for all years, including only cities with at least 500 fire incidents)
| Clifton Park: | 6 minutes |
| Halfmoon: | 6 minutes |
| Niskayuna: | 4 minutes |
| Mechanicville: | 5 minutes |
| Schenectady: | 4 minutes |
| Glenville: | 4 minutes |
| Cohoes: | 4 minutes |
| Waterford: | 5 minutes |
| Colonie: | 7 minutes |
 Based on the reports from the years 2002 - 2018 the average number of fire-related yearly casualties is 1. The highest number of injuries - 4 took place in 2005, and the lowest - 0 in 2002. The data has a constant trend.
The average number of casualties per 1,000 fires is 6. This indicator was the highest - 37 in 2007, and the lowest 0 in 2002. The trend for injuries per 1,000 fire incidents is constant. Compared to the New York value the number of casualties per 1,000 fires is lower.
Based on the reports from the years 2002 - 2018 the average number of fire-related yearly casualties is 1. The highest number of injuries - 4 took place in 2005, and the lowest - 0 in 2002. The data has a constant trend.
The average number of casualties per 1,000 fires is 6. This indicator was the highest - 37 in 2007, and the lowest 0 in 2002. The trend for injuries per 1,000 fire incidents is constant. Compared to the New York value the number of casualties per 1,000 fires is lower.Casualties per 1,000 incidents in Clifton Park, NY compared to nearest cities:
(Note: Based on data for all years, including only cities with at least 500 fire incidents)
| Clifton Park: | 6.7 |
| Halfmoon: | 6.8 |
| Niskayuna: | 13.8 |
| Mechanicville: | 9.4 |
| Schenectady: | 11.2 |
| Glenville: | 2.2 |
| Cohoes: | 13.3 |
| Waterford: | 4.6 |
| Colonie: | 2.6 |
 30.9% incidents where reported in the morning and 69.1% in the evening. The most fires (16.7%) took place on Monday, and the least (12.9%) on Thursday.
 Based on the 2,082 fire incidents from years 2002 - 2018 most fires (13.2%) took place during April, and the least (6.2%) in July.
 Out of all 14,005 cases reported during the years 2002 - 2018, the most belonged to the categories: Rescue & EMS (26.9%), Hazardous Condition (18.6%), and Good Intent Call (16.7%).
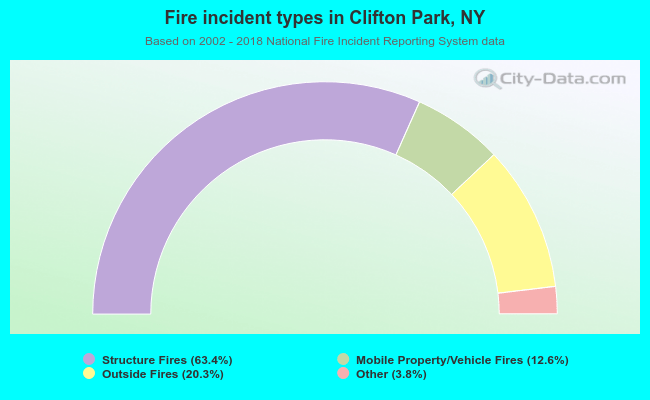 When looking into fire subcategories, the most reports belonged to: Structure Fires (63.4%), and Outside Fires (20.3%).