Sanderson: Fire Incidents, Florida (FL)
Where are fire incidents reported in Sanderson, FL
Something went wrong! Please refresh the page.
|
| |||||||||||||||||||||||||||||||||||||||||||||||||||||||||||||||||||||||||||||||||||||||||||||||||||||||||||||
2002 - 2017 National Fire Incident Reporting System (NFIRS) incidents
- Incident types reported to NFIRS in Sanderson, FL
- 79140.0%Rescue & EMS
- 63031.8%Fire
- 26813.5%Good Intent Call
- 1748.8%Hazardous Condition
- 482.4%Severe Weather
- 452.3%Service Call
- 130.7%False Alarm
- 80.4%Special Incident
- 20.1%Overpressure Rupture
- Fire incident types reported to NFIRS in Sanderson, FL
- 38360.8%Outside Fires
- 11618.4%Mobile Property/Vehicle Fires
- 8713.8%Structure Fires
- 447.0%Other
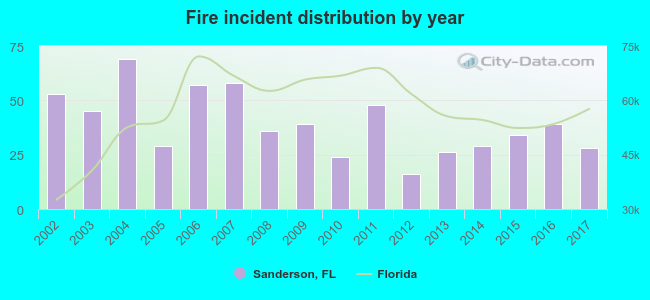 According to the data from the years 2002 - 2017 the average number of fire incidents per year is 39. The highest number of reported fire incidents - 69 took place in 2004, and the least - 16 in 2012. The data has a decreasing trend.
The average number of yearly fire incidents per 10k residents in Sanderson, FL compared to nearest cities:
(Note: Based on data for the last 3 years, including only cities with population 5,000 and above)
| Sanderson: | 27.4 |
| Macclenny: | 83.6 |
| Lake City: | 288.4 |
| Starke: | 142.4 |
| Middleburg: | 6.9 |
| Orange Park: | 19.8 |
| High Springs: | 17.0 |
| Fleming Island: | 1.3 |
| Alachua: | 48.1 |
 The median response time based on all reported fire incidents is 11 minutes. This is higher than the state median value.
The median response time in Sanderson, FL compared to nearest cities:
(Note: Based on data for all years, including only cities with at least 500 fire incidents)
| Sanderson: | 11 minutes |
| Macclenny: | 6 minutes |
| Lake Butler: | 8 minutes |
| Lake City: | 8 minutes |
| Lawtey: | 9 minutes |
| White Springs: | 9 minutes |
| Starke: | 7 minutes |
| Middleburg: | 10 minutes |
| Callahan: | 9 minutes |
 According to the data from the years 2002 - 2017 the average number of fire-related fatalities per year is 0. The highest number of deaths - 2 took place in 2013, and the lowest - 0 in 2002. The data has a constant trend.
 22.4% incidents where reported in the morning and 77.6% in the evening. The most fires (18.4%) took place on Saturday, and the least (11.7%) on Wednesday.
 According to the 630 fire incident reports from years 2002 - 2017 most fires (12.1%) took place during March, and the least (5.2%) in July.
 Out of all 1,979 cases reported during the years 2002 - 2017, the most belonged to the categories: Rescue & EMS (40.0%), Fire (31.8%), and Good Intent Call (13.5%).
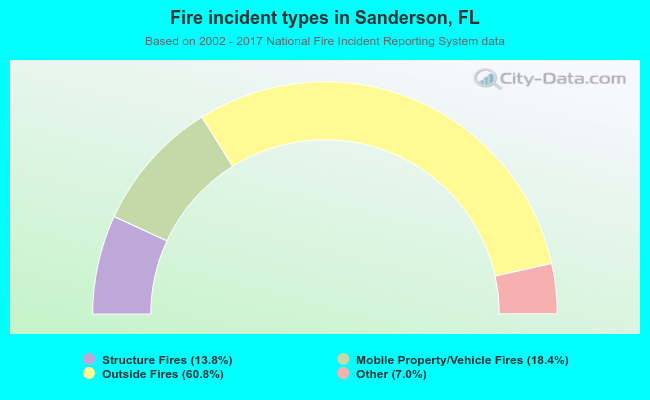 When looking into fire subcategories, the most reports belonged to: Outside Fires (60.8%), and Mobile Property/Vehicle Fires (18.4%).