Lake City: Fire Incidents, Florida (FL)
Where are fire incidents reported in Lake City, FL
Something went wrong! Please refresh the page.
| Fire incidents reported | |
|---|---|
| Sreet name | Count |
| INTERSTATE 75 | 410 |
| US HIGHWAY 90 | 360 |
| US HIGHWAY 441 | 302 |
| STATE ROAD 47 | 174 |
| INTERSTATE 10 | 156 |
| STATE ROAD 247 | 118 |
| BASCOM NORRIS DR | 110 |
| LAKE JEFFERY RD | 98 |
| MARION AVE | 98 |
| COUNTY ROAD 240 | 86 |
| TUSTENUGGEE AVE | 86 |
| MAIN BLVD | 84 |
| DUVAL ST | 82 |
| I75 | 82 |
| PINEMOUNT RD | 76 |
| US HIGHWAY 41 | 68 |
| WASHINGTON ST | 64 |
| COUNTY ROAD 242 | 62 |
| COUNTRY CLUB RD | 60 |
| BAYA DR | 58 |
| COUNTY ROAD 252 | 58 |
| COUNTY ROAD 245 | 54 |
| GUERDON ST | 54 |
| GUM SWAMP RD | 50 |
| I 75 | 50 |
| COUNTY ROAD 18 | 48 |
| SISTERS WELCOME RD | 48 |
| DOUBLE RUN RD | 42 |
| US HIGHWAY 27 | 42 |
| MOORE RD | 40 |
| Other | 2,146 |
2006 - 2018 National Fire Incident Reporting System (NFIRS) incidents
- Incident types reported to NFIRS in Lake City, FL
- 14,15351.6%Rescue & EMS
- 5,26619.2%Fire
- 3,40712.4%Good Intent Call
- 3,12211.4%Hazardous Condition
- 8653.2%False Alarm
- 5101.9%Service Call
- 480.2%Special Incident
- 350.1%Overpressure Rupture
- 300.1%Severe Weather
- Fire incident types reported to NFIRS in Lake City, FL
- 3,01557.3%Outside Fires
- 1,26724.1%Structure Fires
- 87516.6%Mobile Property/Vehicle Fires
- 1092.1%Other
 Based on the data from the years 2006 - 2018 the average number of fires per year is 405. The highest number of fire incidents - 639 took place in 2008, and the least - 169 in 2006. The data has a growing trend.
The average number of yearly fire incidents per 10k residents in Lake City, FL compared to nearest cities:
(Note: Based on data for the last 3 years, including only cities with population 5,000 and above)
| Lake City: | 288.4 |
| Sanderson: | 27.4 |
| Live Oak: | 298.9 |
| High Springs: | 17.0 |
| Alachua: | 48.1 |
| Dowling Park: | 2.6 |
| Macclenny: | 83.6 |
| Starke: | 142.4 |
| Newberry: | 81.3 |
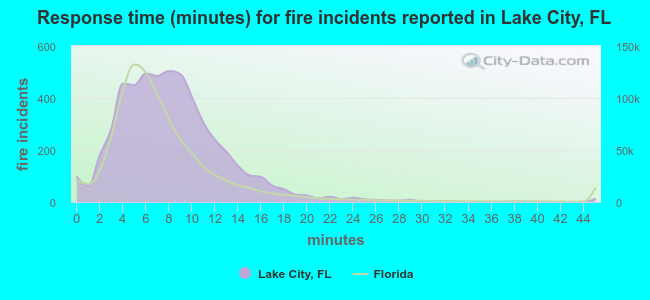 The median response time based on all reported fire incidents is 8 minutes. This is higher compared to the state median value.
The median response time in Lake City, FL compared to nearest cities:
(Note: Based on data for all years, including only cities with at least 500 fire incidents)
| Lake City: | 8 minutes |
| White Springs: | 9 minutes |
| Fort White: | 10 minutes |
| Lake Butler: | 8 minutes |
| Sanderson: | 11 minutes |
| Live Oak: | 9 minutes |
| High Springs: | 9 minutes |
| Jasper: | 10 minutes |
| Alachua: | 10 minutes |
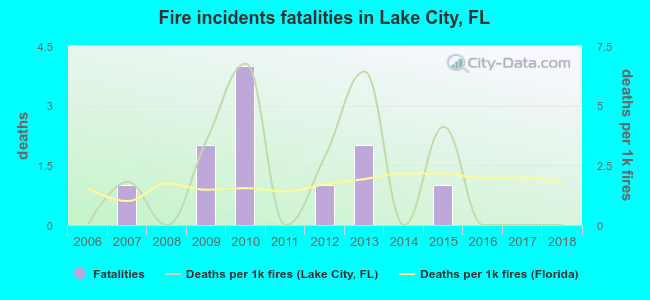 According to the data from the years 2006 - 2018 the average number of fire-related yearly deaths is 1. The highest number of deaths - 4 took place in 2010, and the lowest - 0 in 2006. The data has a constant trend.
The average number of fatalities per 1,000 fires is 2. This indicator was the highest - 7 in 2010, and the lowest 0 in 2006. The trend for deaths per 1,000 fire incidents is constant. Compared to the state value the number of fatalities per 1,000 fires is higher.
According to the data from the years 2006 - 2018 the average number of fire-related yearly deaths is 1. The highest number of deaths - 4 took place in 2010, and the lowest - 0 in 2006. The data has a constant trend.
The average number of fatalities per 1,000 fires is 2. This indicator was the highest - 7 in 2010, and the lowest 0 in 2006. The trend for deaths per 1,000 fire incidents is constant. Compared to the state value the number of fatalities per 1,000 fires is higher.Deaths per 1,000 incidents in Lake City, FL compared to nearest cities:
(Note: Based on data for all years, including only cities with at least 2,500 fire incidents)
| Lake City: | 2.1 |
| Gainesville: | 1.7 |
| Jacksonville: | 2.1 |
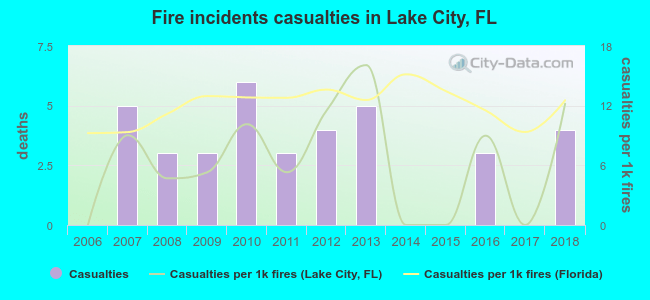 According to the reports from the years 2006 - 2018 the average number of fire-related casualties per year is 3. The highest number of reported injuries - 6 took place in 2010, and the lowest - 0 in 2006. The data has an increasing trend.
The average number of casualties per 1,000 fire incidents is 6. This indicator was the highest - 16 in 2013, and the lowest 0 in 2006. The trend for injuries per 1,000 fire incidents is rising. Compared to the Florida value the number of injuries per 1,000 fires is lower.
According to the reports from the years 2006 - 2018 the average number of fire-related casualties per year is 3. The highest number of reported injuries - 6 took place in 2010, and the lowest - 0 in 2006. The data has an increasing trend.
The average number of casualties per 1,000 fire incidents is 6. This indicator was the highest - 16 in 2013, and the lowest 0 in 2006. The trend for injuries per 1,000 fire incidents is rising. Compared to the Florida value the number of injuries per 1,000 fires is lower.Casualties per 1,000 incidents in Lake City, FL compared to nearest cities:
(Note: Based on data for all years, including only cities with at least 500 fire incidents)
| Lake City: | 6.8 |
| White Springs: | 3.8 |
| Fort White: | 13.9 |
| Lake Butler: | 0.0 |
| Sanderson: | 7.9 |
| Live Oak: | 2.0 |
| High Springs: | 1.9 |
| Jasper: | 7.2 |
| Alachua: | 2.1 |
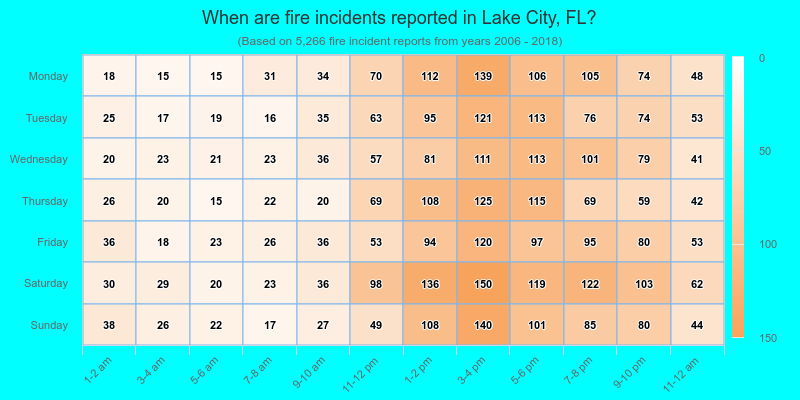
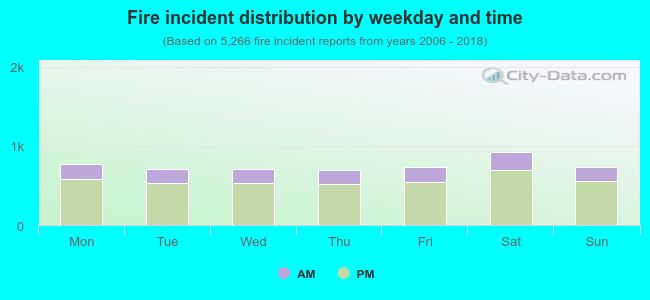 25.0% incidents where reported in the morning and 75.0% in the evening. The most fires (17.6%) took place on Saturday, and the least (13.1%) on Thursday.
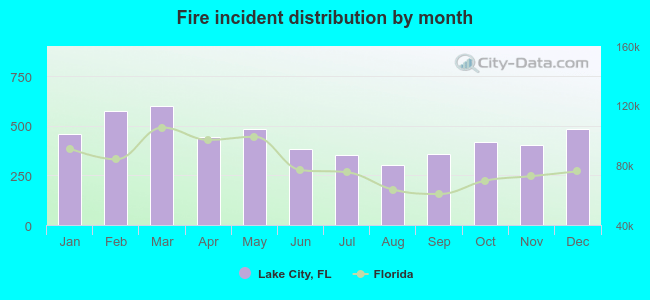 Based on the 5,266 fire incidents from years 2006 - 2018 most fires (11.4%) took place during March, and the least (5.8%) in August.
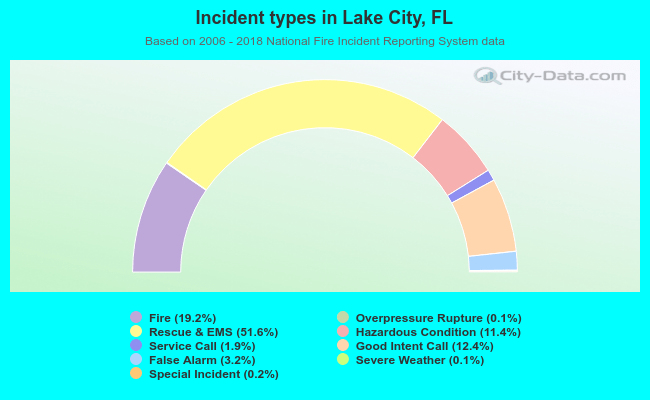 Out of all 27,436 cases reported during the years 2006 - 2018, the most belonged to the categories: Rescue & EMS (51.6%), Fire (19.2%), and Good Intent Call (12.4%).
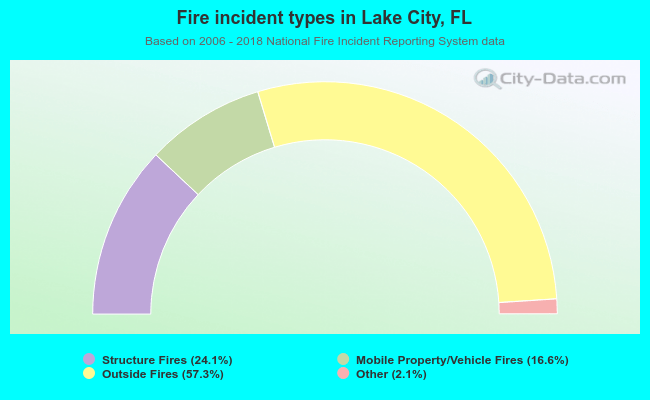 When looking into fire subcategories, the most reports belonged to: Outside Fires (57.3%), and Structure Fires (24.1%).