Rye: Fire Incidents, New York (NY)
Where are fire incidents reported in Rye, NY
Something went wrong! Please refresh the page.
|
| |||||||||||||||||||||||||||||||||||||||||||||||||||||||||||||||||||||||||||||||||||||||||||||||||||||||||||||
2003 - 2018 National Fire Incident Reporting System (NFIRS) incidents
- Incident types reported to NFIRS in Rye, NY
- 2,60138.1%Hazardous Condition
- 1,82326.7%False Alarm
- 95914.0%Service Call
- 68510.0%Fire
- 5197.6%Good Intent Call
- 1832.7%Rescue & EMS
- 550.8%Severe Weather
- Fire incident types reported to NFIRS in Rye, NY
- 37955.3%Structure Fires
- 19628.6%Outside Fires
- 10715.6%Mobile Property/Vehicle Fires
- 30.4%Other
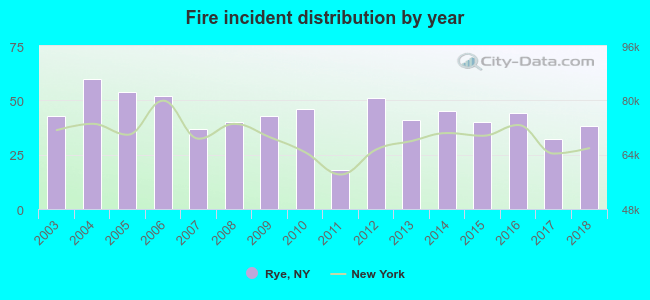 Based on the data from the years 2003 - 2018 the average number of fires per year is 43. The highest number of reported fires - 60 took place in 2004, and the least - 18 in 2011. The data has a decreasing trend.
The average number of yearly fire incidents per 10k residents in Rye, NY compared to nearest cities:
(Note: Based on data for the last 3 years, including only cities with population 5,000 and above)
| Rye: | 23.8 |
| Port Chester: | 7.6 |
| Harrison: | 10.5 |
| Rye Brook: | 19.9 |
| Larchmont: | 22.9 |
| White Plains: | 29.4 |
| Scarsdale: | 26.9 |
| New Rochelle: | 75.2 |
| Eastchester: | 27.6 |
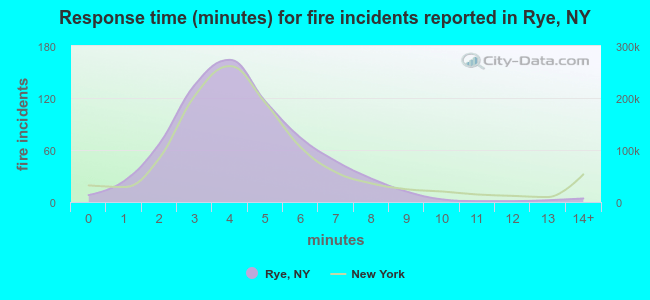 The median response time based on all reported fire incidents is 4 minutes. This is about the same as the New York median value.
The median response time in Rye, NY compared to nearest cities:
(Note: Based on data for all years, including only cities with at least 500 fire incidents)
| Rye: | 4 minutes |
| Larchmont: | 2 minutes |
| White Plains: | 4 minutes |
| Scarsdale: | 4 minutes |
| New Rochelle: | 6 minutes |
| Greenwich: | 5 minutes |
| Eastchester: | 5 minutes |
| Hartsdale: | 4 minutes |
| Glen Cove: | 4 minutes |
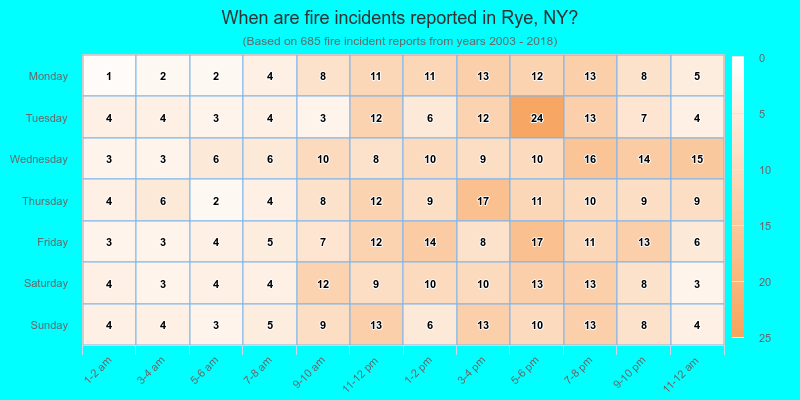
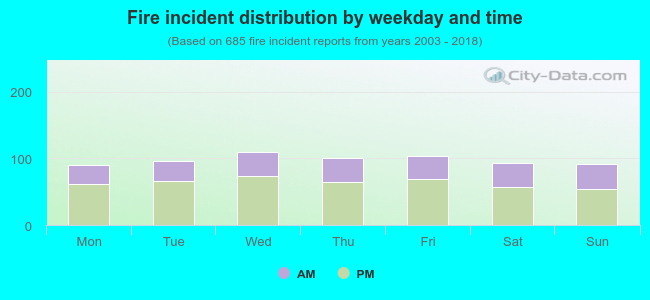 34.7% incidents where reported in the morning and 65.3% in the evening. The most fires (16.1%) took place on Wednesday, and the least (13.1%) on Monday.
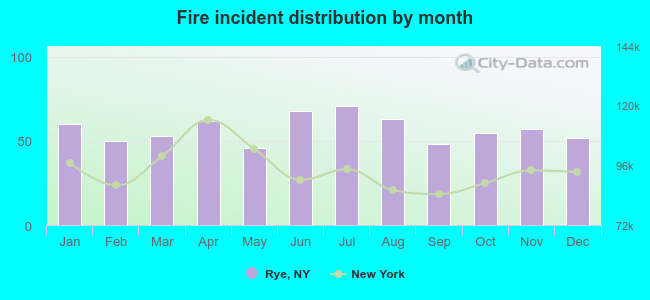 According to the 685 fires from years 2003 - 2018 most fires (10.4%) took place during July, and the least (6.7%) in May.
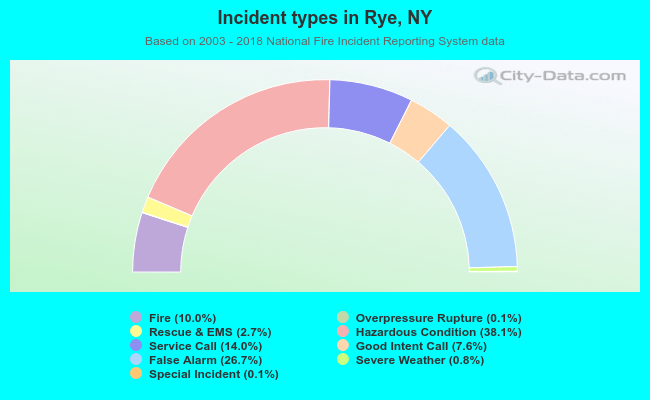 Out of all 6,835 cases reported during the years 2003 - 2018, the most belonged to the categories: Hazardous Condition (38.1%), False Alarm (26.7%), and Service Call (14.0%).
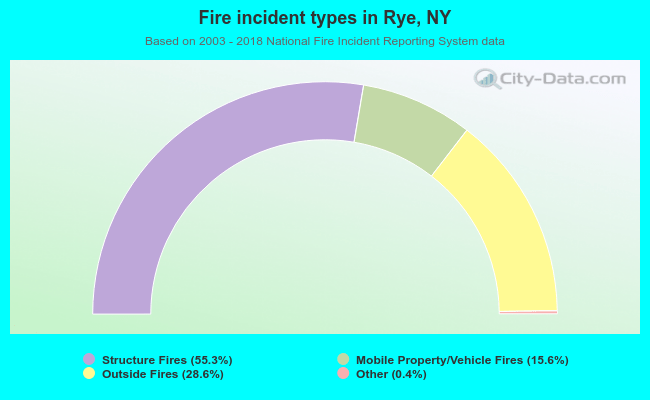 When looking into fire subcategories, the most incidents belonged to: Structure Fires (55.3%), and Outside Fires (28.6%).