Ringwood: Fire Incidents, New Jersey (NJ)
Where are fire incidents reported in Ringwood, NJ
Something went wrong! Please refresh the page.
| Fire incidents reported | |
|---|---|
| Sreet name | Count |
| STONETOWN RD | 116 |
| SKYLINE LAKES DR | 114 |
| PETERS MINE RD | 58 |
| LAKEVIEW AVE | 48 |
| CONKLINTOWN RD | 40 |
| SLOATSBURG RD | 40 |
| CUPSAW DR | 38 |
| SKYLINE / ELFD DR | 38 |
| WESTBROOK RD | 36 |
| CEDAR RD | 30 |
| MARGARET KING AVE | 30 |
| MOHAWK TRL | 28 |
| SKYLINE / SLFD DR | 28 |
| SNAKE DEN RD | 28 |
| NORTHGATE PARK | 26 |
| MAGEE RD | 24 |
| OAKWOOD DR | 24 |
| ALTA VISTA DR | 22 |
| BEARFORT TER | 22 |
| CUPSAW AVE | 22 |
| VAN DUNK LN | 22 |
| WHITE RD | 22 |
| GREENWOOD LAKE TPKE | 20 |
| OLIVER PL | 20 |
| RINGWOOD AVE | 20 |
| SKYLINE SLFD DR | 20 |
| SUNSET RD | 20 |
| BELLOT RD | 18 |
| CARLETONDALE RD | 18 |
| ERSKINE RD | 18 |
| Other | 132 |
2003 - 2018 National Fire Incident Reporting System (NFIRS) incidents
- Incident types reported to NFIRS in Ringwood, NJ
- 1,28531.1%Hazardous Condition
- 1,22329.6%False Alarm
- 1,14227.6%Fire
- 1854.5%Service Call
- 1593.8%Rescue & EMS
- 892.2%Good Intent Call
- 270.7%Special Incident
- 190.5%Overpressure Rupture
- 50.1%Severe Weather
- Fire incident types reported to NFIRS in Ringwood, NJ
- 53747.0%Structure Fires
- 31827.8%Outside Fires
- 17615.4%Other
- 1119.7%Mobile Property/Vehicle Fires
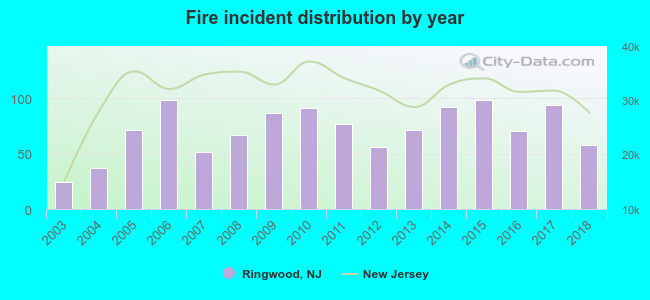 According to the data from the years 2003 - 2018 the average number of fires per year is 71. The highest number of reported fires - 98 took place in 2006, and the least - 24 in 2003. The data has an increasing trend.
The average number of yearly fire incidents per 10k residents in Ringwood, NJ compared to nearest cities:
(Note: Based on data for the last 3 years, including only cities with population 5,000 and above)
| Ringwood: | 59.8 |
| Wanaque: | 16.9 |
| Oakland: | 19.9 |
| Franklin Lakes: | 20.3 |
| West Milford: | 33.1 |
| Ramsey: | 53.6 |
| Bloomingdale: | 25.3 |
| Pompton Lakes: | 14.9 |
| Allendale: | 31.9 |
 The median response time based on all reported fire incidents is 3 minutes. This is lower compared to the state median value.
The median response time in Ringwood, NJ compared to nearest cities:
(Note: Based on data for all years, including only cities with at least 500 fire incidents)
| Ringwood: | 3 minutes |
| Oakland: | 5 minutes |
| West Milford: | 6 minutes |
| Ramsey: | 7 minutes |
| Wyckoff: | 5 minutes |
| Kinnelon: | 5 minutes |
| Wayne: | 5 minutes |
| Ridgewood: | 3 minutes |
| Hawthorne: | 5 minutes |
 33.2% incidents where reported in the morning and 66.8% in the evening. The most fires (16.8%) took place on Saturday, and the least (11.5%) on Monday.
 According to the 1,142 fires from years 2003 - 2018 most fires (12.2%) took place during April, and the least (4.3%) in September.
 Out of all 4,134 cases reported during the years 2003 - 2018, the most belonged to the categories: Hazardous Condition (31.1%), False Alarm (29.6%), and Fire (27.6%).
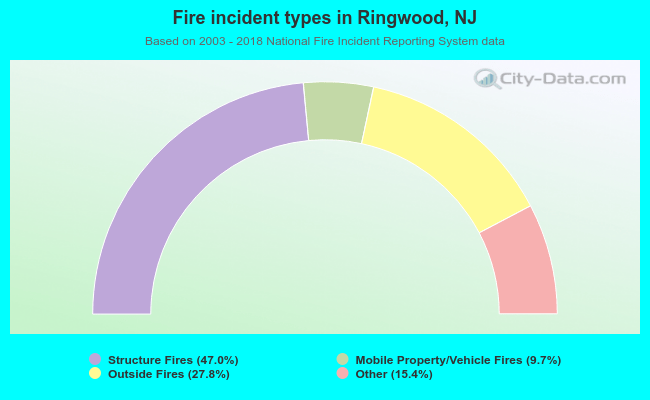 When looking into fire subcategories, the most incidents belonged to: Structure Fires (47.0%), and Outside Fires (27.8%).