Richmond: Fire Incidents, Virginia (VA)
Where are fire incidents reported in Richmond, VA
Something went wrong! Please refresh the page.
| Fire incidents reported | |
|---|---|
| Sreet name | Count |
| MIDLOTHIAN TPKE | 808 |
| JEFFERSON DAVIS HWY | 670 |
| BROAD ST | 640 |
| GRACE ST | 498 |
| W BROAD ST | 458 |
| CHAMBERLAYNE AVE | 430 |
| CARY ST | 356 |
| FRANKLIN ST | 352 |
| FOREST HILL AVE | 344 |
| BOULEVARD | 318 |
| HULL STREET RD | 284 |
| NINE MILE RD | 250 |
| MAIN ST | 240 |
| 21ST ST | 238 |
| BELLE ISLE | 214 |
| BELLS ROAD | 212 |
| STAPLES MILL RD | 212 |
| MARSHALL ST | 200 |
| HULL ST | 192 |
| WESTOVER HILLS BLVD | 190 |
| MECHANICSVILLE TPKE | 186 |
| BROAD ROCK BLVD | 184 |
| WALMSLEY BLVD | 178 |
| HULL STREET ROAD | 174 |
| GROVE AVE | 168 |
| NORTH AVE | 164 |
| COURTHOUSE RD | 162 |
| COALTER ST | 150 |
| ENGLESIDE DR | 142 |
| LEIGH ST | 142 |
| Other | 16,172 |
2002 - 2018 National Fire Incident Reporting System (NFIRS) incidents
- Incident types reported to NFIRS in Richmond, VA
- 142,11050.9%Rescue & EMS
- 39,39814.1%Hazardous Condition
- 39,34114.1%Good Intent Call
- 24,9288.9%Fire
- 18,0546.5%False Alarm
- 13,1454.7%Service Call
- 1,7050.6%Overpressure Rupture
- 3900.1%Special Incident
- Fire incident types reported to NFIRS in Richmond, VA
- 9,93339.8%Structure Fires
- 9,49538.1%Outside Fires
- 4,62818.6%Mobile Property/Vehicle Fires
- 8723.5%Other
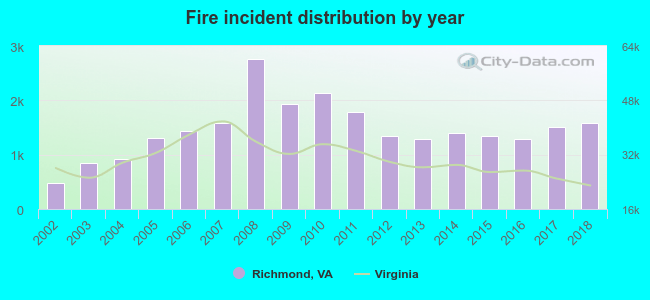 Based on the data from the years 2002 - 2018 the average number of fire incidents per year is 1,466. The highest number of reported fires - 2,767 took place in 2008, and the least - 474 in 2002. The data has a growing trend.
The average number of yearly fire incidents per 10k residents in Richmond, VA compared to nearest cities:
(Note: Based on data for the last 3 years, including only cities with population 5,000 and above)
| Richmond: | 66.9 |
| Bon Air: | 18.3 |
| Bensley: | 56.7 |
| Highland Springs: | 22.3 |
| Sandston: | 66.5 |
| Mechanicsville: | 60.6 |
| Glen Allen: | 76.3 |
| Bellwood: | 45.7 |
| Chester: | 80.8 |
 The median response time based on all reported fire incidents is 5 minutes. This is lower compared to the state median value.
The median response time in Richmond, VA compared to nearest cities:
(Note: Based on data for all years, including only cities with at least 500 fire incidents)
| Richmond: | 5 minutes |
| Highland Springs: | 5 minutes |
| Sandston: | 6 minutes |
| Mechanicsville: | 8 minutes |
| Glen Allen: | 6 minutes |
| Chester: | 6 minutes |
| Ashland: | 8 minutes |
| Hopewell: | 5 minutes |
| Colonial Heights: | 6 minutes |
 Based on the reports from the years 2002 - 2018 the average number of fire-related yearly deaths is 3. The highest number of deaths - 9 took place in 2010, and the lowest - 0 in 2005. The data has a decreasing trend.
The average number of deaths per 1,000 fire incidents is 2. This indicator was the highest - 4 in 2010, and the lowest 0 in 2005. The trend for deaths per 1,000 fire incidents is dropping. Compared to the state value the number of fatalities per 1,000 fire incidents is about the same.
Based on the reports from the years 2002 - 2018 the average number of fire-related yearly deaths is 3. The highest number of deaths - 9 took place in 2010, and the lowest - 0 in 2005. The data has a decreasing trend.
The average number of deaths per 1,000 fire incidents is 2. This indicator was the highest - 4 in 2010, and the lowest 0 in 2005. The trend for deaths per 1,000 fire incidents is dropping. Compared to the state value the number of fatalities per 1,000 fire incidents is about the same.Deaths per 1,000 incidents in Richmond, VA compared to nearest cities:
(Note: Based on data for all years, including only cities with at least 2,500 fire incidents)
| Richmond: | 2.2 |
| Mechanicsville: | 0.8 |
| Chester: | 3.2 |
| Petersburg: | 2.8 |
| Williamsburg: | 2.2 |
 Based on the reports from the years 2002 - 2018 the average number of fire-related casualties per year is 38. The highest number of reported injuries - 65 took place in 2008, and the lowest - 8 in 2002. The data has a growing trend.
The average number of casualties per 1,000 fire incidents is 25. This indicator was the highest - 37 in 2018, and the lowest 17 in 2002. The trend for injuries per 1,000 fires is growing. Compared to the Virginia value the number of casualties per 1,000 fires is higher.
Based on the reports from the years 2002 - 2018 the average number of fire-related casualties per year is 38. The highest number of reported injuries - 65 took place in 2008, and the lowest - 8 in 2002. The data has a growing trend.
The average number of casualties per 1,000 fire incidents is 25. This indicator was the highest - 37 in 2018, and the lowest 17 in 2002. The trend for injuries per 1,000 fires is growing. Compared to the Virginia value the number of casualties per 1,000 fires is higher.Casualties per 1,000 incidents in Richmond, VA compared to nearest cities:
(Note: Based on data for all years, including only cities with at least 500 fire incidents)
| Richmond: | 26.0 |
| Highland Springs: | 44.5 |
| Sandston: | 18.9 |
| Mechanicsville: | 4.6 |
| Glen Allen: | 24.1 |
| Chester: | 40.8 |
| Ashland: | 6.1 |
| Hopewell: | 36.9 |
| Colonial Heights: | 45.2 |
 30.6% incidents where reported in the morning and 69.4% in the evening. The most fires (15.3%) took place on Saturday, and the least (13.3%) on Wednesday.
 According to the 24,928 incident reports from years 2002 - 2018 most fires (10.1%) took place during March, and the least (7.1%) in October.
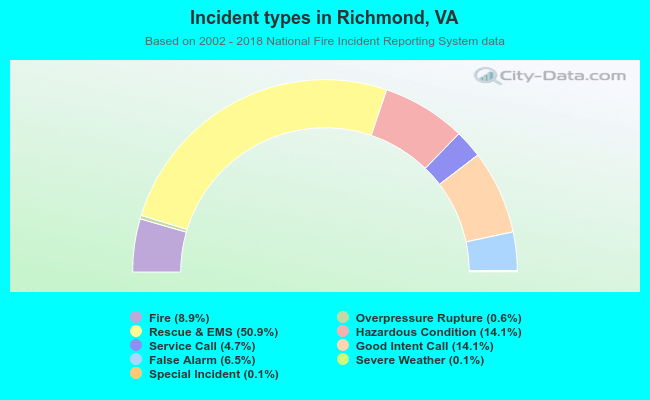 Out of all 279,327 cases reported during the years 2002 - 2018, the most belonged to the categories: Rescue & EMS (50.9%), Hazardous Condition (14.1%), and Good Intent Call (14.1%).
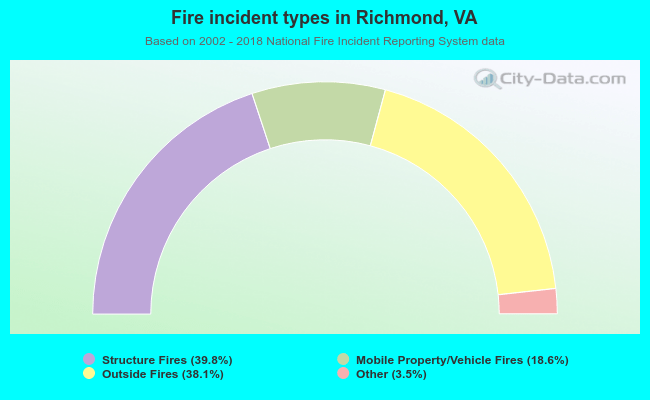 When looking into fire subcategories, the most incidents belonged to: Structure Fires (39.8%), and Outside Fires (38.1%).