Colonial Heights: Fire Incidents, Virginia (VA)
Where are fire incidents reported in Colonial Heights, VA
Something went wrong! Please refresh the page.
| Fire incidents reported | |
|---|---|
| Sreet name | Count |
| BOULEVARD | 264 |
| SOUTHPARK BLVD | 186 |
| CONDUIT RD | 128 |
| SOUTHPARK CIR | 84 |
| TEMPLE AVE | 64 |
| ARCHER AVE | 58 |
| SOUTH AVE | 44 |
| ELLERSLIE AVE | 38 |
| I95 SOUTHBOUND | 38 |
| ROSLYN RD | 38 |
| RUFFIN MILL RD | 36 |
| BRANDERS BRIDGE RD | 34 |
| CLEARFIELD CIR | 32 |
| I95 NORTHBOUND | 32 |
| JEFFERSON DAVIS HWY | 32 |
| OLD OAK LN | 30 |
| COLONIAL CT | 28 |
| SOUTHGATE SQ | 28 |
| LAKEVIEW PARK RD | 26 |
| 95 (WOODS EDGE-COL HTS) | 24 |
| FRANKLIN AVE | 22 |
| I 95-SOUTHBOUND | 22 |
| NEWCASTLE DR | 22 |
| WOODS EDGE RD | 22 |
| I-95 | 20 |
| LAFAYETTE AVE | 20 |
| I-95 NORTHBOUND | 18 |
| LAKEVIEW AVE | 18 |
| PERTHSHIRE LN | 16 |
| WAKEFIELD AVE | 16 |
2002 - 2018 National Fire Incident Reporting System (NFIRS) incidents
- Incident types reported to NFIRS in Colonial Heights, VA
- 14,31763.9%Rescue & EMS
- 2,56811.5%Service Call
- 1,8888.4%Hazardous Condition
- 1,4476.5%Good Intent Call
- 1,4176.3%Fire
- 6723.0%False Alarm
- 600.3%Special Incident
- 250.1%Overpressure Rupture
- Fire incident types reported to NFIRS in Colonial Heights, VA
- 53637.8%Structure Fires
- 53637.8%Outside Fires
- 31622.3%Mobile Property/Vehicle Fires
- 292.0%Other
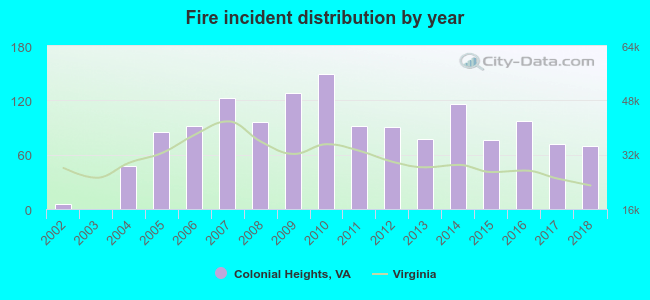 According to the data from the years 2002 - 2018 the average number of fires per year is 83. The highest number of reported fire incidents - 149 took place in 2010, and the least - 0 in 2003. The data has a growing trend.
The average number of yearly fire incidents per 10k residents in Colonial Heights, VA compared to nearest cities:
(Note: Based on data for the last 3 years, including only cities with population 5,000 and above)
| Colonial Heights: | 44.9 |
| Ettrick: | 11.2 |
| Petersburg: | 39.0 |
| Hopewell: | 38.1 |
| Chester: | 80.8 |
| Bellwood: | 45.7 |
| Bensley: | 56.7 |
| Sandston: | 66.5 |
| Richmond: | 66.9 |
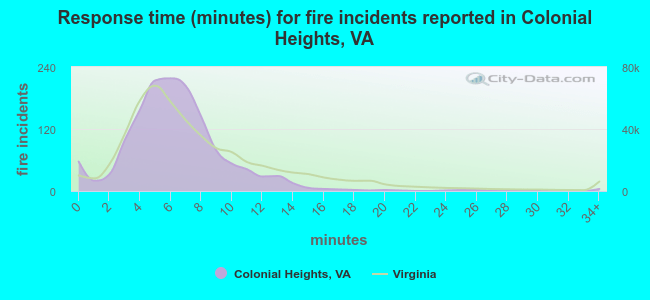 The median response time based on all reported fire incidents is 6 minutes. This is comparable to the Virginia median value.
The median response time in Colonial Heights, VA compared to nearest cities:
(Note: Based on data for all years, including only cities with at least 500 fire incidents)
| Colonial Heights: | 6 minutes |
| Petersburg: | 6 minutes |
| Hopewell: | 5 minutes |
| Chester: | 6 minutes |
| Prince George: | 8 minutes |
| Sandston: | 6 minutes |
| Charles City: | 16 minutes |
| Richmond: | 5 minutes |
| Highland Springs: | 5 minutes |
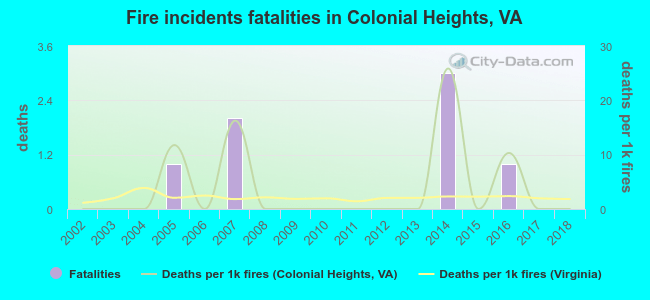 Based on the data from the years 2002 - 2018 the average number of fire-related yearly deaths is 0. The highest number of reported deaths - 3 took place in 2014, and the lowest - 0 in 2002. The data has a constant trend.
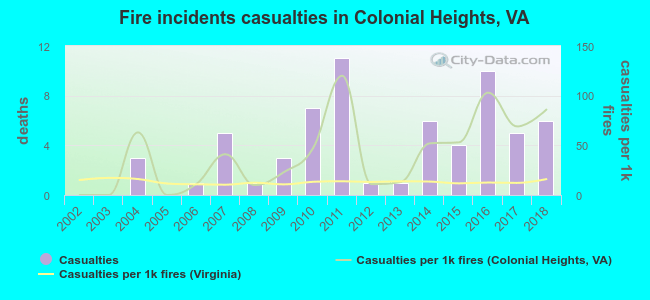 According to the reports from the years 2002 - 2018 the average number of fire-related yearly casualties is 4. The highest number of injuries - 11 took place in 2011, and the lowest - 0 in 2002. The data has an increasing trend.
The average number of casualties per 1,000 fire incidents is 41. This indicator was the highest - 120 in 2011, and the lowest 0 in 2002. The trend for casualties per 1,000 fires is rising. Compared to the Virginia value the number of casualties per 1,000 incidents is much higher.
According to the reports from the years 2002 - 2018 the average number of fire-related yearly casualties is 4. The highest number of injuries - 11 took place in 2011, and the lowest - 0 in 2002. The data has an increasing trend.
The average number of casualties per 1,000 fire incidents is 41. This indicator was the highest - 120 in 2011, and the lowest 0 in 2002. The trend for casualties per 1,000 fires is rising. Compared to the Virginia value the number of casualties per 1,000 incidents is much higher.Casualties per 1,000 incidents in Colonial Heights, VA compared to nearest cities:
(Note: Based on data for all years, including only cities with at least 500 fire incidents)
| Colonial Heights: | 45.2 |
| Petersburg: | 46.1 |
| Hopewell: | 36.9 |
| Chester: | 40.8 |
| Prince George: | 3.7 |
| Sandston: | 18.9 |
| Charles City: | 0.0 |
| Richmond: | 26.0 |
| Highland Springs: | 44.5 |
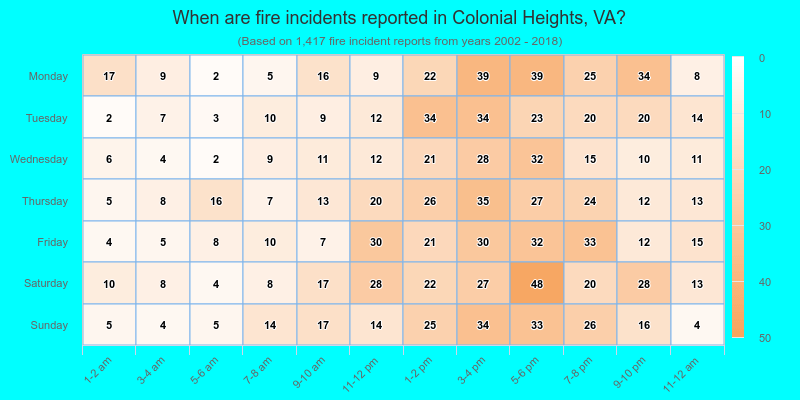
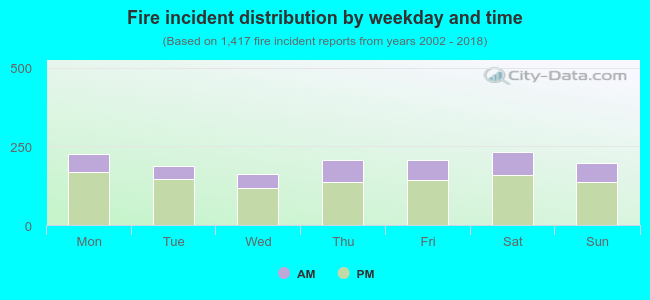 29.1% incidents where reported in the morning and 70.9% in the evening. The most fires (16.4%) took place on Saturday, and the least (11.4%) on Wednesday.
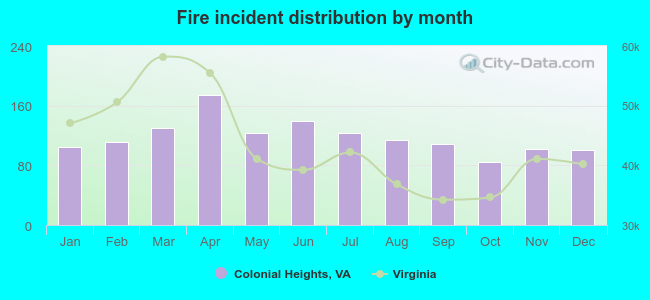 Based on the 1,417 incident reports from years 2002 - 2018 most fires (12.3%) took place during April, and the least (6.0%) in October.
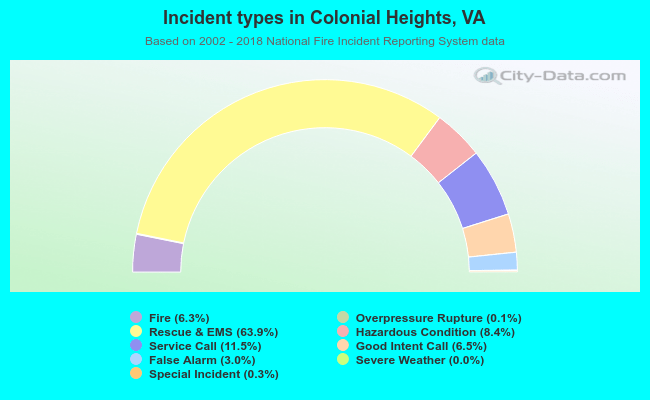 Out of all 22,399 cases reported during the years 2002 - 2018, the most belonged to the categories: Rescue & EMS (63.9%), Service Call (11.5%), and Hazardous Condition (8.4%).
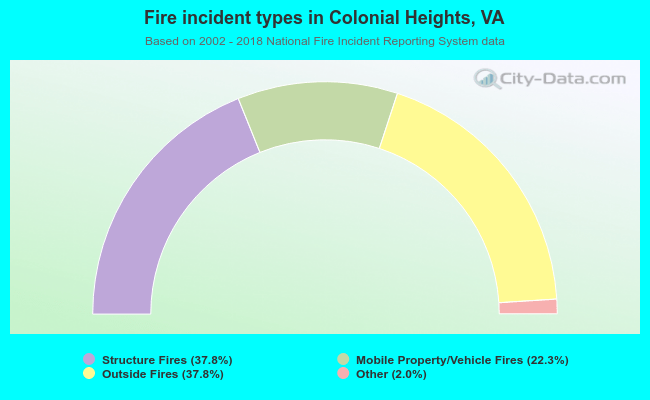 When looking into fire subcategories, the most incidents belonged to: Structure Fires (37.8%), and Outside Fires (37.8%).