Quincy: Fire Incidents, Florida (FL)
Where are fire incidents reported in Quincy, FL
Something went wrong! Please refresh the page.
| Fire incidents reported | |
|---|---|
| Sreet name | Count |
| SYCAMORE RD | 84 |
| JEFFERSON ST | 70 |
| BLUE STAR HWY | 56 |
| PAT THOMAS PKY | 56 |
| JUNIPER CREEK RD | 54 |
| ATLANTA ST | 52 |
| ATTAPULGUS HWY | 46 |
| OLD FEDERAL RD | 46 |
| HOSFORD HWY | 42 |
| PAT THOMAS PARKWAY | 38 |
| JUNIPER RD | 36 |
| LONNIE CLARK RD | 36 |
| HUTCHINSON FERRY RD | 34 |
| STEWART ST | 34 |
| BEN BOSTICK RD | 32 |
| BRISTOL HWY | 32 |
| LITTLE SYCAMORE RD | 30 |
| BLUE STAR HIGHWAY | 28 |
| I10 FWY | 28 |
| WINDING CREEK RD | 28 |
| OLD FEDERAL ROAD | 26 |
| WEST JEFFERSON STREET | 24 |
| CRAWFORD ST | 22 |
| GREENSBORO HWY | 22 |
| KING ST | 22 |
| BAINBRIDGE HWY | 20 |
| BLUE STAR HWY | 20 |
| FLORIDA AVE | 20 |
| I-10 | 20 |
| POST PLANT ROAD | 20 |
| Other | 2,116 |
2002 - 2018 National Fire Incident Reporting System (NFIRS) incidents
- Incident types reported to NFIRS in Quincy, FL
- 3,51636.2%Service Call
- 3,19432.9%Fire
- 9549.8%Good Intent Call
- 9159.4%Hazardous Condition
- 6236.4%Rescue & EMS
- 4634.8%False Alarm
- 420.4%Severe Weather
- Fire incident types reported to NFIRS in Quincy, FL
- 1,37543.0%Outside Fires
- 1,10234.5%Structure Fires
- 65820.6%Mobile Property/Vehicle Fires
- 591.8%Other
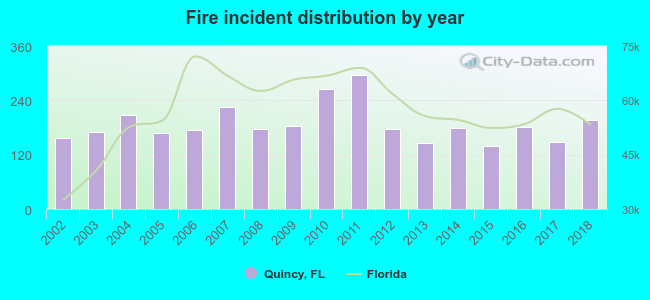 According to the data from the years 2002 - 2018 the average number of fires per year is 188. The highest number of reported fires - 297 took place in 2011, and the least - 140 in 2015. The data has an increasing trend.
The average number of yearly fire incidents per 10k residents in Quincy, FL compared to nearest cities:
(Note: Based on data for the last 3 years, including only cities with population 5,000 and above)
| Quincy: | 221.5 |
| Tallahassee: | 60.5 |
| Cypress: | 4.3 |
| Marianna: | 169.4 |
| Youngstown: | 35.9 |
 The median response time based on all reported fire incidents is 6 minutes. This is close to the Florida median value.
The median response time in Quincy, FL compared to nearest cities:
(Note: Based on data for all years, including only cities with at least 500 fire incidents)
| Quincy: | 6 minutes |
| Midway: | 11 minutes |
| Havana: | 5 minutes |
| Tallahassee: | 7 minutes |
| Blountstown: | 4 minutes |
| Crawfordville: | 7 minutes |
| Marianna: | 7 minutes |
| Monticello: | 9 minutes |
| Cottondale: | 10 minutes |
 Based on the reports from the years 2002 - 2018 the average number of fire-related yearly deaths is 1. The highest number of deaths - 4 took place in 2010, and the lowest - 0 in 2003. The data has a dropping trend.
The average number of fatalities per 1,000 fires is 4. This indicator was the highest - 28 in 2013, and the lowest 0 in 2003. The trend for fatalities per 1,000 fire incidents is decreasing. Compared to the Florida value the number of fatalities per 1,000 fire incidents is much higher.
Based on the reports from the years 2002 - 2018 the average number of fire-related yearly deaths is 1. The highest number of deaths - 4 took place in 2010, and the lowest - 0 in 2003. The data has a dropping trend.
The average number of fatalities per 1,000 fires is 4. This indicator was the highest - 28 in 2013, and the lowest 0 in 2003. The trend for fatalities per 1,000 fire incidents is decreasing. Compared to the Florida value the number of fatalities per 1,000 fire incidents is much higher.Deaths per 1,000 incidents in Quincy, FL compared to nearest cities:
(Note: Based on data for all years, including only cities with at least 2,500 fire incidents)
| Quincy: | 4.1 |
| Tallahassee: | 1.5 |
 Based on the reports from the years 2002 - 2018 the average number of fire-related casualties per year is 1. The highest number of reported injuries - 3 took place in 2003, and the lowest - 0 in 2008. The data has a constant trend.
The average number of casualties per 1,000 fires is 5. This indicator was the highest - 18 in 2003, and the lowest 0 in 2008. The trend for casualties per 1,000 fires is declining. Compared to the state value the number of casualties per 1,000 incidents is much lower.
Based on the reports from the years 2002 - 2018 the average number of fire-related casualties per year is 1. The highest number of reported injuries - 3 took place in 2003, and the lowest - 0 in 2008. The data has a constant trend.
The average number of casualties per 1,000 fires is 5. This indicator was the highest - 18 in 2003, and the lowest 0 in 2008. The trend for casualties per 1,000 fires is declining. Compared to the state value the number of casualties per 1,000 incidents is much lower.Casualties per 1,000 incidents in Quincy, FL compared to nearest cities:
(Note: Based on data for all years, including only cities with at least 500 fire incidents)
| Quincy: | 5.3 |
| Midway: | 11.1 |
| Havana: | 1.0 |
| Tallahassee: | 14.1 |
| Blountstown: | 1.4 |
| Crawfordville: | 3.4 |
| Marianna: | 2.5 |
| Monticello: | 6.3 |
| Cottondale: | 1.3 |
 26.0% incidents where reported in the morning and 74.0% in the evening. The most fires (16.4%) took place on Saturday, and the least (12.4%) on Wednesday.
 According to the 3,194 reports from years 2002 - 2018 most fires (11.8%) took place during March, and the least (5.3%) in July.
 Out of all 9,715 cases reported during the years 2002 - 2018, the most belonged to the categories: Service Call (36.2%), Fire (32.9%), and Good Intent Call (9.8%).
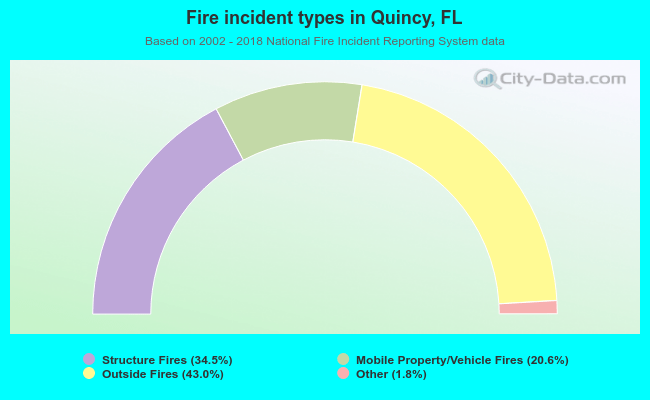 When looking into fire subcategories, the most incidents belonged to: Outside Fires (43.0%), and Structure Fires (34.5%).