Potomac: Fire Incidents, Maryland (MD)
Where are fire incidents reported in Potomac, MD
Something went wrong! Please refresh the page.
|
| |||||||||||||||||||||||||||||||||||||||||||||||||||||||||||||||||||||||||||||||||||||||||||||||||||||||||||||
| Other | 149 | |||||||||||||||||||||||||||||||||||||||||||||||||||||||||||||||||||||||||||||||||||||||||||||||||||||||||||||
2004 - 2018 National Fire Incident Reporting System (NFIRS) incidents
- Incident types reported to NFIRS in Potomac, MD
- 11,69163.7%Rescue & EMS
- 2,39513.0%Good Intent Call
- 1,4678.0%False Alarm
- 1,1836.4%Service Call
- 1,1296.2%Hazardous Condition
- 4332.4%Fire
- 280.2%Special Incident
- 190.1%Overpressure Rupture
- Fire incident types reported to NFIRS in Potomac, MD
- 19645.3%Structure Fires
- 15235.1%Outside Fires
- 6013.9%Mobile Property/Vehicle Fires
- 255.8%Other
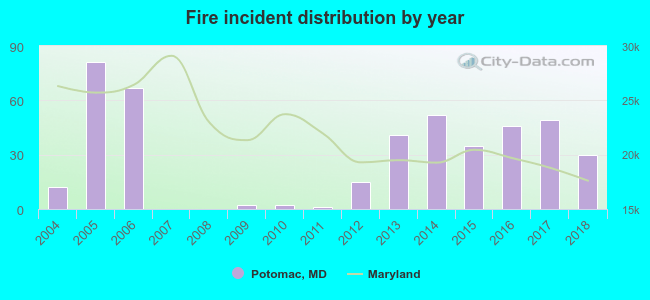 According to the data from the years 2004 - 2018 the average number of fires per year is 29. The highest number of fires - 81 took place in 2005, and the least - 0 in 2007. The data has a rising trend.
The average number of yearly fire incidents per 10k residents in Potomac, MD compared to nearest cities:
(Note: Based on data for the last 3 years, including only cities with population 5,000 and above)
| Potomac: | 9.3 |
| North Bethesda: | 2.2 |
| Rockville: | 18.6 |
| Bethesda: | 13.1 |
| Darnestown: | 20.6 |
| Gaithersburg: | 21.4 |
| Silver Spring: | 44.6 |
| Takoma Park: | 14.0 |
| Colesville: | 14.3 |

 Based on the data from the years 2004 - 2018 the average number of fire-related yearly casualties is 1. The highest number of reported casualties - 4 took place in 2017, and the lowest - 0 in 2004. The data has a constant trend.
 27.3% incidents where reported in the morning and 72.7% in the evening. The most fires (16.9%) took place on Sunday, and the least (11.5%) on Wednesday.
 According to the 433 fires from years 2004 - 2018 most fires (13.2%) took place during March, and the least (5.1%) in October.
 Out of all 18,353 cases reported during the years 2004 - 2018, the most belonged to the categories: Rescue & EMS (63.7%), Good Intent Call (13.0%), and False Alarm (8.0%).
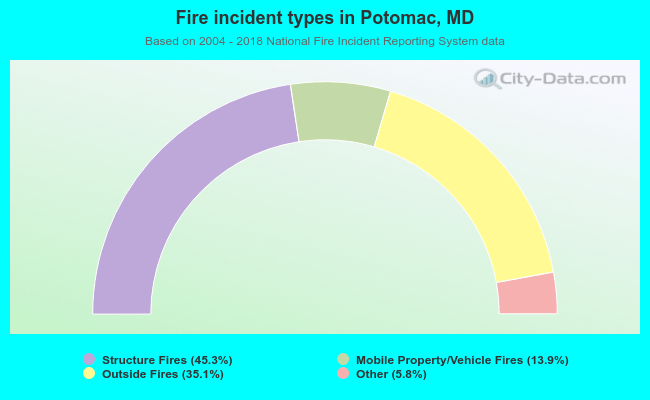 When looking into fire subcategories, the most reports belonged to: Structure Fires (45.3%), and Outside Fires (35.1%).