Darnestown: Fire Incidents, Maryland (MD)
Where are fire incidents reported in Darnestown, MD
Something went wrong! Please refresh the page.
|
| |||||||||||||||||||||||||||||||||||||||||||||||||||||||||||||||||||||||||||||||||||||||||||||||||||||||||||||
2009 - 2016 National Fire Incident Reporting System (NFIRS) incidents
- Incident types reported to NFIRS in Darnestown, MD
- 2,54966.7%Rescue & EMS
- 47212.3%Good Intent Call
- 2687.0%False Alarm
- 2195.7%Service Call
- 2015.3%Hazardous Condition
- 1012.6%Fire
- 60.2%Special Incident
- 40.1%Overpressure Rupture
- Fire incident types reported to NFIRS in Darnestown, MD
- 4948.5%Structure Fires
- 3433.7%Outside Fires
- 1817.8%Mobile Property/Vehicle Fires
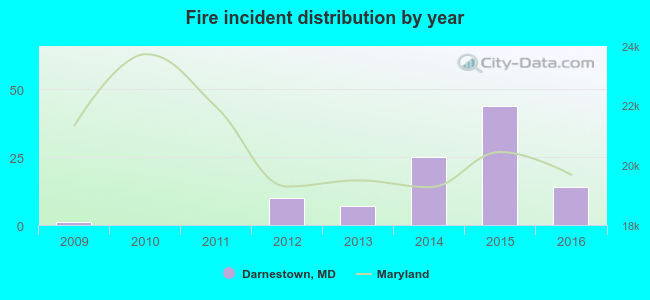 According to the data from the years 2009 - 2016 the average number of fire incidents per year is 13. The highest number of reported fire incidents - 44 took place in 2015, and the least - 0 in 2010. The data has a growing trend.
The average number of yearly fire incidents per 10k residents in Darnestown, MD compared to nearest cities:
(Note: Based on data for the last 3 years, including only cities with population 5,000 and above)
| Darnestown: | 20.6 |
| Gaithersburg: | 21.4 |
| Germantown: | 10.3 |
| Montgomery Village: | 8.4 |
| Rockville: | 18.6 |
| Poolesville: | 20.7 |
| Potomac: | 9.3 |
| Clarksburg: | 18.6 |
| North Bethesda: | 2.2 |

 27.7% incidents where reported in the morning and 72.3% in the evening. The most fires (20.8%) took place on Tuesday, and the least (5.9%) on Thursday.
 Based on the 101 fire incident reports from years 2009 - 2016 most fires (16.8%) took place during December, and the least (1.0%) in May.
 Out of all 3,822 cases reported during the years 2009 - 2016, the most belonged to the categories: Rescue & EMS (66.7%), Good Intent Call (12.3%), and False Alarm (7.0%).
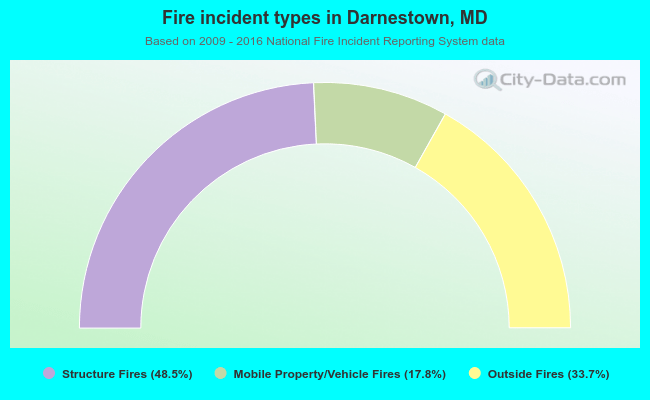 When looking into fire subcategories, the most incidents belonged to: Structure Fires (48.5%), and Outside Fires (33.7%).