Plymouth: Fire Incidents, Massachusetts (MA)
Where are fire incidents reported in Plymouth, MA
Something went wrong! Please refresh the page.
| Fire incidents reported | |
|---|---|
| Sreet name | Count |
| STATE ROAD RD | 214 |
| LONG POND ROAD RD | 180 |
| COURT STREET ST | 176 |
| SAMOSET STREET ST | 168 |
| COLONY PLACE PL | 142 |
| CARVER ROAD RD | 112 |
| SOUTH STREET ST | 86 |
| WATER STREET ST | 80 |
| BOURNE ROAD RD | 76 |
| WARREN AVENUE AVE | 72 |
| SOUTH MEADOW ROAD RD | 68 |
| HOME DEPOT DRIVE DR | 64 |
| FEDERAL FURNACE ROAD RD | 60 |
| ALGONQUIN TERRACE TER | 58 |
| SANDWICH STREET ST | 58 |
| LONG POND ROAD | 56 |
| BEAVER DAM ROAD RD | 54 |
| COMMERCE WAY WAY | 54 |
| COURT STREET | 50 |
| SHOPS AT 5 WAY | 48 |
| PILGRIM HILL ROAD RD | 46 |
| COLONY PLACE | 44 |
| SHOPS AT 5 WAY WAY | 44 |
| WATER STREET | 42 |
| STATE ROAD | 38 |
| CHERRY STREET ST | 36 |
| INDUSTRIAL PARK ROAD RD | 36 |
| OLD SANDWICH ROAD RD | 36 |
| SAMOSET STREET | 36 |
| ROCKY HILL ROAD RD | 34 |
| Other | 1,534 |
2002 - 2018 National Fire Incident Reporting System (NFIRS) incidents
- Incident types reported to NFIRS in Plymouth, MA
- 26,66352.5%Rescue & EMS
- 6,12812.1%False Alarm
- 5,64011.1%Hazardous Condition
- 4,3368.5%Service Call
- 4,0958.1%Good Intent Call
- 3,8027.5%Fire
- 700.1%Overpressure Rupture
- Fire incident types reported to NFIRS in Plymouth, MA
- 1,73545.6%Outside Fires
- 1,38436.4%Structure Fires
- 56114.8%Mobile Property/Vehicle Fires
- 1223.2%Other
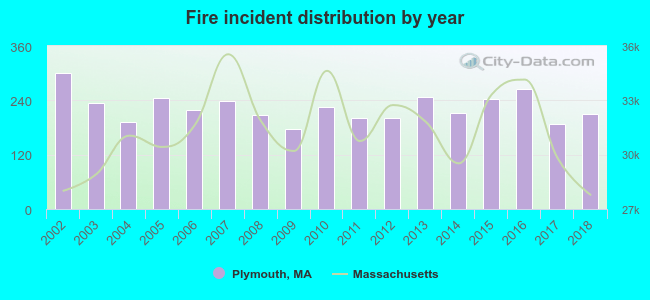 Based on the data from the years 2002 - 2018 the average number of fires per year is 224. The highest number of fires - 300 took place in 2002, and the least - 176 in 2009. The data has a decreasing trend.
The average number of yearly fire incidents per 10k residents in Plymouth, MA compared to nearest cities:
(Note: Based on data for the last 3 years, including only cities with population 5,000 and above)
| Plymouth: | 294.0 |
| Kingston: | 82.3 |
| Carver: | 4.9 |
| Halifax: | 35.5 |
| Pembroke: | 3.6 |
| Middleborough: | 34.8 |
| Wareham: | 46.6 |
| East Bridgewater: | 25.9 |
| Rochester: | 13.4 |
 The median response time based on all reported fire incidents is 5 minutes. This is higher than the state median value.
The median response time in Plymouth, MA compared to nearest cities:
(Note: Based on data for all years, including only cities with at least 500 fire incidents)
| Plymouth: | 5 minutes |
| Kingston: | 6 minutes |
| Duxbury: | 4 minutes |
| Marshfield: | 4 minutes |
| Hanson: | 5 minutes |
| Middleborough: | 5 minutes |
| Wareham: | 6 minutes |
| Onset: | 3 minutes |
| East Bridgewater: | 5 minutes |
 According to the reports from the years 2002 - 2018 the average number of fire-related fatalities per year is 1. The highest number of reported deaths - 5 took place in 2009, and the lowest - 0 in 2003. The data has a constant trend.
The average number of fatalities per 1,000 fires is 4. This indicator was the highest - 28 in 2009, and the lowest 0 in 2003. The trend for deaths per 1,000 incidents is increasing. Compared to the state value the number of fatalities per 1,000 fire incidents is much higher.
According to the reports from the years 2002 - 2018 the average number of fire-related fatalities per year is 1. The highest number of reported deaths - 5 took place in 2009, and the lowest - 0 in 2003. The data has a constant trend.
The average number of fatalities per 1,000 fires is 4. This indicator was the highest - 28 in 2009, and the lowest 0 in 2003. The trend for deaths per 1,000 incidents is increasing. Compared to the state value the number of fatalities per 1,000 fire incidents is much higher.
 Based on the data from the years 2002 - 2018 the average number of fire-related casualties per year is 5. The highest number of casualties - 15 took place in 2013, and the lowest - 2 in 2003. The data has a constant trend.
The average number of injuries per 1,000 fires is 25. This indicator was the highest - 61 in 2013, and the lowest 8 in 2016. The trend for injuries per 1,000 fire incidents is rising. Compared to the state value the number of casualties per 1,000 fire incidents is much higher.
Based on the data from the years 2002 - 2018 the average number of fire-related casualties per year is 5. The highest number of casualties - 15 took place in 2013, and the lowest - 2 in 2003. The data has a constant trend.
The average number of injuries per 1,000 fires is 25. This indicator was the highest - 61 in 2013, and the lowest 8 in 2016. The trend for injuries per 1,000 fire incidents is rising. Compared to the state value the number of casualties per 1,000 fire incidents is much higher.Casualties per 1,000 incidents in Plymouth, MA compared to nearest cities:
(Note: Based on data for all years, including only cities with at least 500 fire incidents)
| Plymouth: | 24.5 |
| Kingston: | 8.6 |
| Duxbury: | 6.5 |
| Marshfield: | 13.5 |
| Hanson: | 4.0 |
| Middleborough: | 7.5 |
| Wareham: | 25.5 |
| Onset: | 28.4 |
| East Bridgewater: | 17.7 |
 30.0% incidents where reported in the morning and 70.0% in the evening. The most fires (15.5%) took place on Sunday, and the least (12.8%) on Wednesday.
 According to the 3,802 fires from years 2002 - 2018 most fires (12.8%) took place during May, and the least (5.2%) in October.
 Out of all 50,827 cases reported during the years 2002 - 2018, the most belonged to the categories: Rescue & EMS (52.5%), False Alarm (12.1%), and Hazardous Condition (11.1%).
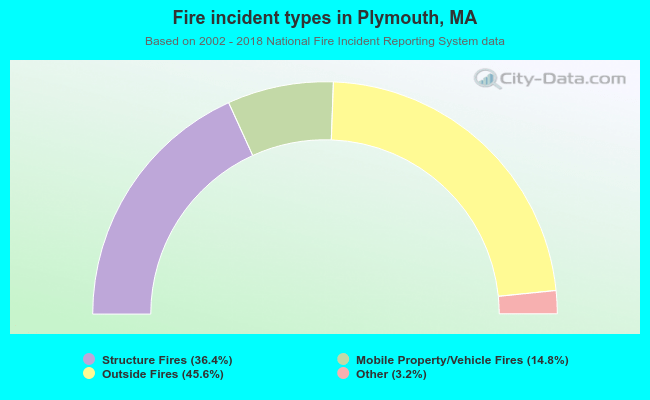 When looking into fire subcategories, the most reports belonged to: Outside Fires (45.6%), and Structure Fires (36.4%).