Middleborough: Fire Incidents, Massachusetts (MA)
Where are fire incidents reported in Middleborough, MA
Something went wrong! Please refresh the page.
| Fire incidents reported | |
|---|---|
| Sreet name | Count |
| WAREHAM ST | 208 |
| EAST GROVE ST | 132 |
| PLYMOUTH ST | 120 |
| WEST GROVE ST | 82 |
| BEDFORD ST | 72 |
| EVERETT ST | 60 |
| SOUTH MAIN ST | 60 |
| WOOD ST | 54 |
| CENTER ST | 42 |
| NORTH ST | 40 |
| OLD CENTER ST | 38 |
| PURCHASE ST | 38 |
| MARION RD | 36 |
| 495 INTERSTATE HWY | 34 |
| MILLER ST | 34 |
| PLYMPTON ST | 34 |
| THOMPSON ST | 32 |
| FOREST ST | 30 |
| OAK ST | 30 |
| ROCKY MEADOW ST | 30 |
| CHERRY ST | 28 |
| RIVER ST | 28 |
| DERRY PARK DRIVE | 26 |
| MERCHANTS WAY | 26 |
| CHESTNUT ST | 24 |
| VERNON ST | 24 |
| PLEASANT ST | 22 |
| SPRUCE ST | 22 |
| THOMAS ST | 22 |
| WALNUT ST | 22 |
| Other | 290 |
2002 - 2018 National Fire Incident Reporting System (NFIRS) incidents
- Incident types reported to NFIRS in Middleborough, MA
- 8,43532.4%Rescue & EMS
- 7,36928.3%Good Intent Call
- 3,40113.1%Hazardous Condition
- 2,4429.4%False Alarm
- 2,4329.4%Service Call
- 1,7406.7%Fire
- 1300.5%Special Incident
- 330.1%Overpressure Rupture
- Fire incident types reported to NFIRS in Middleborough, MA
- 75743.5%Outside Fires
- 55732.0%Structure Fires
- 36521.0%Mobile Property/Vehicle Fires
- 613.5%Other
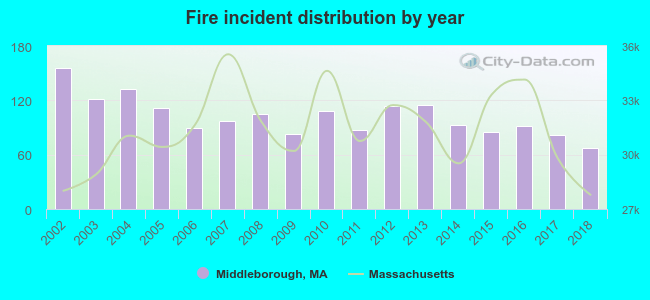 Based on the data from the years 2002 - 2018 the average number of fires per year is 102. The highest number of fires - 156 took place in 2002, and the least - 67 in 2018. The data has a decreasing trend.
The average number of yearly fire incidents per 10k residents in Middleborough, MA compared to nearest cities:
(Note: Based on data for the last 3 years, including only cities with population 5,000 and above)
| Middleborough: | 34.8 |
| Lakeville: | 26.4 |
| Carver: | 4.9 |
| Halifax: | 35.5 |
| Bridgewater: | 125.4 |
| Raynham: | 53.8 |
| Rochester: | 13.4 |
| East Bridgewater: | 25.9 |
| Taunton: | 25.0 |
 The median response time based on all reported fire incidents is 5 minutes. This is higher than the state median value.
The median response time in Middleborough, MA compared to nearest cities:
(Note: Based on data for all years, including only cities with at least 500 fire incidents)
| Middleborough: | 5 minutes |
| Lakeville: | 6 minutes |
| Bridgewater: | 5 minutes |
| Raynham: | 4 minutes |
| East Bridgewater: | 5 minutes |
| Taunton: | 4 minutes |
| West Bridgewater: | 4 minutes |
| Kingston: | 6 minutes |
| Hanson: | 5 minutes |
 According to the data from the years 2002 - 2018 the average number of fire-related yearly casualties is 1. The highest number of casualties - 2 took place in 2003, and the lowest - 0 in 2002. The data has a constant trend.
The average number of injuries per 1,000 fire incidents is 8. This indicator was the highest - 22 in 2014, and the lowest 0 in 2002. The trend for injuries per 1,000 fire incidents is growing. Compared to the state value the number of injuries per 1,000 fire incidents is lower.
According to the data from the years 2002 - 2018 the average number of fire-related yearly casualties is 1. The highest number of casualties - 2 took place in 2003, and the lowest - 0 in 2002. The data has a constant trend.
The average number of injuries per 1,000 fire incidents is 8. This indicator was the highest - 22 in 2014, and the lowest 0 in 2002. The trend for injuries per 1,000 fire incidents is growing. Compared to the state value the number of injuries per 1,000 fire incidents is lower.Casualties per 1,000 incidents in Middleborough, MA compared to nearest cities:
(Note: Based on data for all years, including only cities with at least 500 fire incidents)
| Middleborough: | 7.5 |
| Lakeville: | 0.0 |
| Bridgewater: | 7.5 |
| Raynham: | 2.1 |
| East Bridgewater: | 17.7 |
| Taunton: | 0.8 |
| West Bridgewater: | 10.4 |
| Kingston: | 8.6 |
| Hanson: | 4.0 |
 30.6% incidents where reported in the morning and 69.4% in the evening. The most fires (16.5%) took place on Saturday, and the least (12.4%) on Wednesday.
 According to the 1,740 fire incident reports from years 2002 - 2018 most fires (14.8%) took place during April, and the least (4.5%) in December.
 Out of all 26,001 cases reported during the years 2002 - 2018, the most belonged to the categories: Rescue & EMS (32.4%), Good Intent Call (28.3%), and Hazardous Condition (13.1%).
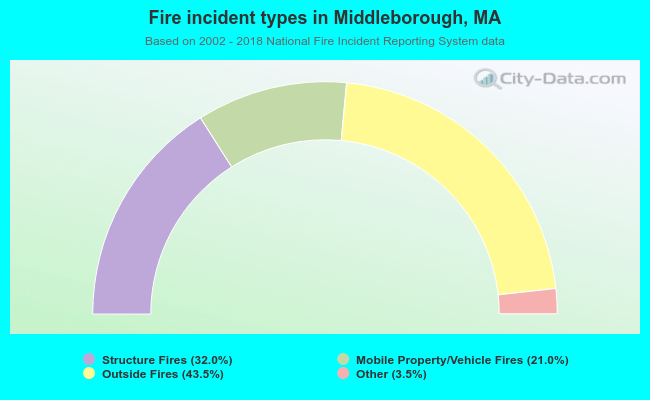 When looking into fire subcategories, the most incidents belonged to: Outside Fires (43.5%), and Structure Fires (32.0%).