Perrysburg: Fire Incidents, Ohio (OH)
Where are fire incidents reported in Perrysburg, OH
Something went wrong! Please refresh the page.
| Fire incidents reported | |
|---|---|
| Sreet name | Count |
| OREGON RD | 184 |
| FREMONT PIKE | 128 |
| LOUISIANA AVE | 76 |
| ZOAR DR | 76 |
| DIXIE HWY | 72 |
| REITZ RD | 64 |
| RIVER RD | 60 |
| TRACY RD | 60 |
| FIVE POINT RD | 58 |
| GLENWOOD RD | 58 |
| LAKE VUE DR | 56 |
| ECKEL JUNCTION RD | 54 |
| LIME CITY RD | 54 |
| TRINITY CT | 50 |
| BOUNDARY ST | 40 |
| FREMONT PIKE | 40 |
| ROACHTON RD | 40 |
| TRUMAN RD | 40 |
| MCCUTCHEONVILLE RD | 38 |
| I-75 HWY | 36 |
| INDIANA AVE | 34 |
| SIXTH ST | 32 |
| FORT MEIGS RD | 30 |
| FRONT ST | 30 |
| INDIANA AV | 30 |
| INDIANA | 26 |
| SOUTH BOUNDARY ST | 26 |
| CARRONADE DR | 24 |
| SECOND ST | 24 |
| ECKEL RD | 22 |
| Other | 288 |
2002 - 2018 National Fire Incident Reporting System (NFIRS) incidents
- Incident types reported to NFIRS in Perrysburg, OH
- 7,47156.2%Rescue & EMS
- 1,85013.9%Fire
- 1,2099.1%False Alarm
- 1,1368.5%Hazardous Condition
- 8826.6%Good Intent Call
- 6695.0%Service Call
- 520.4%Overpressure Rupture
- 280.2%Special Incident
- Fire incident types reported to NFIRS in Perrysburg, OH
- 97352.6%Structure Fires
- 52428.3%Outside Fires
- 33818.3%Mobile Property/Vehicle Fires
- 150.8%Other
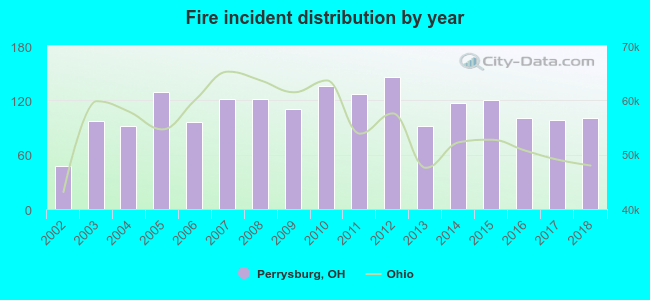 Based on the data from the years 2002 - 2018 the average number of fires per year is 109. The highest number of reported fire incidents - 146 took place in 2012, and the least - 47 in 2002. The data has an increasing trend.
The average number of yearly fire incidents per 10k residents in Perrysburg, OH compared to nearest cities:
(Note: Based on data for the last 3 years, including only cities with population 5,000 and above)
| Perrysburg: | 46.6 |
| Maumee: | 38.2 |
| Rossford: | 41.5 |
| Waterville: | 43.5 |
| Northwood: | 84.3 |
| Toledo: | 41.6 |
| Oregon: | 15.7 |
| Sylvania: | 29.4 |
| Bowling Green: | 23.2 |
 The median response time based on all reported fire incidents is 7 minutes. This is comparable to the state median value.
The median response time in Perrysburg, OH compared to nearest cities:
(Note: Based on data for all years, including only cities with at least 500 fire incidents)
| Perrysburg: | 7 minutes |
| Maumee: | 5 minutes |
| Rossford: | 6 minutes |
| Holland: | 7 minutes |
| Northwood: | 7 minutes |
| Toledo: | 4 minutes |
| Oregon: | 9 minutes |
| Sylvania: | 5 minutes |
| Bowling Green: | 6 minutes |
 Based on the reports from the years 2002 - 2018 the average number of fire-related casualties per year is 1. The highest number of injuries - 2 took place in 2002, and the lowest - 0 in 2005. The data has a declining trend.
The average number of casualties per 1,000 fires is 8. This indicator was the highest - 43 in 2002, and the lowest 0 in 2005. The trend for injuries per 1,000 fire incidents is declining. Compared to the state value the number of injuries per 1,000 incidents is much lower.
Based on the reports from the years 2002 - 2018 the average number of fire-related casualties per year is 1. The highest number of injuries - 2 took place in 2002, and the lowest - 0 in 2005. The data has a declining trend.
The average number of casualties per 1,000 fires is 8. This indicator was the highest - 43 in 2002, and the lowest 0 in 2005. The trend for injuries per 1,000 fire incidents is declining. Compared to the state value the number of injuries per 1,000 incidents is much lower.
 32.1% incidents where reported in the morning and 67.9% in the evening. The most fires (15.9%) took place on Wednesday, and the least (13.2%) on Tuesday.
 Based on the 1,850 fire incident reports from years 2002 - 2018 most fires (10.3%) took place during April, and the least (6.9%) in January.
 Out of all 13,300 cases reported during the years 2002 - 2018, the most belonged to the categories: Rescue & EMS (56.2%), Fire (13.9%), and False Alarm (9.1%).
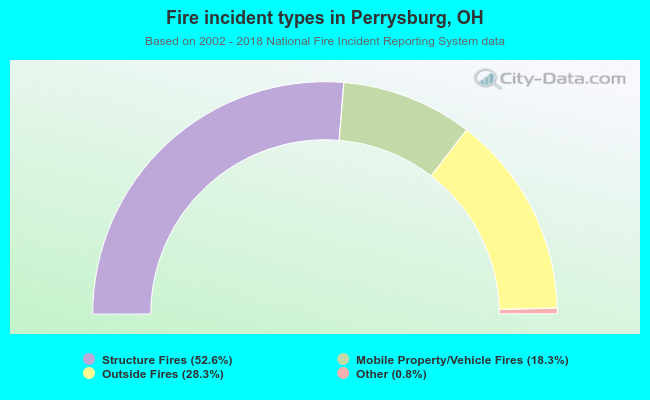 When looking into fire subcategories, the most incidents belonged to: Structure Fires (52.6%), and Outside Fires (28.3%).