Oregon: Fire Incidents, Ohio (OH)
Where are fire incidents reported in Oregon, OH
Something went wrong! Please refresh the page.
|
| |||||||||||||||||||||||||||||||||||||||||||||||||||||||||||||||||||||||||||||||||||||||||||||||||||||||||||||
2003 - 2018 National Fire Incident Reporting System (NFIRS) incidents
- Incident types reported to NFIRS in Oregon, OH
- 9,67386.1%Rescue & EMS
- 5134.6%Fire
- 4894.4%False Alarm
- 2452.2%Service Call
- 1711.5%Hazardous Condition
- 1251.1%Good Intent Call
- Fire incident types reported to NFIRS in Oregon, OH
- 22844.4%Outside Fires
- 18435.9%Structure Fires
- 8616.8%Mobile Property/Vehicle Fires
- 152.9%Other
 According to the data from the years 2003 - 2018 the average number of fires per year is 32. The highest number of fires - 67 took place in 2012, and the least - 0 in 2005. The data has a rising trend.
The average number of yearly fire incidents per 10k residents in Oregon, OH compared to nearest cities:
(Note: Based on data for the last 3 years, including only cities with population 5,000 and above)
| Oregon: | 15.7 |
| Northwood: | 84.3 |
| Toledo: | 41.6 |
| Rossford: | 41.5 |
| Perrysburg: | 46.6 |
| Maumee: | 38.2 |
| Sylvania: | 29.4 |
| Waterville: | 43.5 |
| Bowling Green: | 23.2 |
 The median response time based on all reported fire incidents is 9 minutes. This is higher than the state median value.
The median response time in Oregon, OH compared to nearest cities:
(Note: Based on data for all years, including only cities with at least 500 fire incidents)
| Oregon: | 9 minutes |
| Northwood: | 7 minutes |
| Toledo: | 4 minutes |
| Rossford: | 6 minutes |
| Temperance: | 6 minutes |
| Perrysburg: | 7 minutes |
| Maumee: | 5 minutes |
| Holland: | 7 minutes |
| Sylvania: | 5 minutes |
 Based on the reports from the years 2003 - 2018 the average number of fire-related fatalities per year is 0. The highest number of deaths - 2 took place in 2010, and the lowest - 0 in 2003. The data has a constant trend.
 31.0% incidents where reported in the morning and 69.0% in the evening. The most fires (17.7%) took place on Saturday, and the least (12.7%) on Wednesday.
 Based on the 513 fire incident reports from years 2003 - 2018 most fires (13.5%) took place during May, and the least (3.9%) in October.
 Out of all 11,233 cases reported during the years 2003 - 2018, the most belonged to the categories: Rescue & EMS (86.1%), Fire (4.6%), and False Alarm (4.4%).
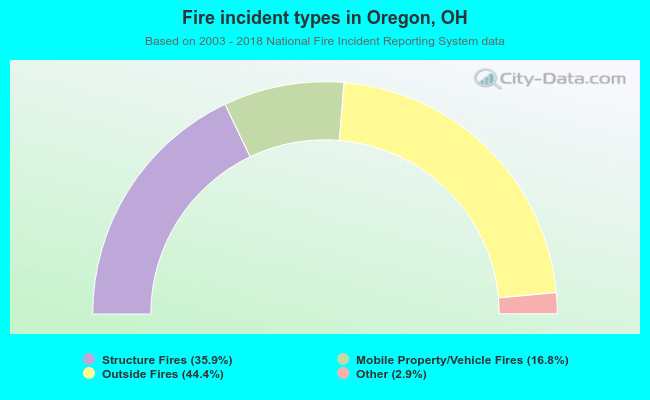 When looking into fire subcategories, the most incidents belonged to: Outside Fires (44.4%), and Structure Fires (35.9%).