Pennsville: Fire Incidents, New Jersey (NJ)
Where are fire incidents reported in Pennsville, NJ
Something went wrong! Please refresh the page.
| Fire incidents reported | |
|---|---|
| Sreet name | Count |
| BROADWAY | 290 |
| EATON RD | 276 |
| KENT AVE | 120 |
| BROADWAY WAY | 108 |
| HOOK RD | 76 |
| PITTSFIELD ST | 64 |
| HIGHLAND AVE | 62 |
| FORT MOTT RD | 54 |
| WINGATE DR | 54 |
| BROADWAY HWY | 50 |
| INDUSTRIAL PARK RD | 46 |
| MEADOW RD | 40 |
| RUTGERS RD | 32 |
| HARVARD RD | 26 |
| LEE AVE | 24 |
| QUEEN AVE | 20 |
| LEHIGH RD | 18 |
| SUPAWNA RD | 18 |
| GEORGIA RD | 16 |
| MAHONEY RD | 16 |
| BRANDRIFF AVE | 14 |
| OBERLIN RD | 14 |
| ENLOW PL | 12 |
| MAPLE AVE | 12 |
| SPARKS AVE | 12 |
| VICTORY AVE | 12 |
| CHURCHTOWN RD | 10 |
| EATON ROAD | 10 |
| FENWICK AVE | 10 |
| FERRY RD | 10 |
2003 - 2018 National Fire Incident Reporting System (NFIRS) incidents
- Incident types reported to NFIRS in Pennsville, NJ
- 1,18433.0%Fire
- 67318.7%Good Intent Call
- 59316.5%Hazardous Condition
- 53514.9%Rescue & EMS
- 52014.5%False Alarm
- 631.8%Service Call
- 110.3%Severe Weather
- 90.3%Overpressure Rupture
- 50.1%Special Incident
- Fire incident types reported to NFIRS in Pennsville, NJ
- 72661.3%Structure Fires
- 31126.3%Outside Fires
- 1139.5%Mobile Property/Vehicle Fires
- 342.9%Other
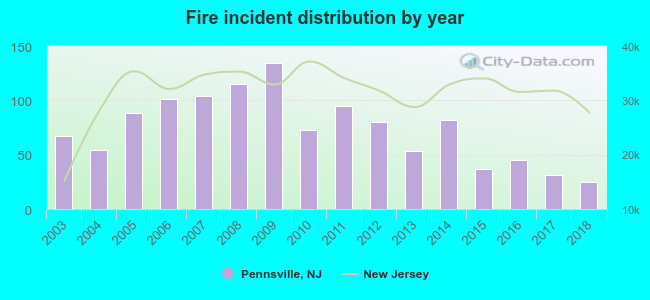 According to the data from the years 2003 - 2018 the average number of fire incidents per year is 74. The highest number of fire incidents - 134 took place in 2009, and the least - 25 in 2018. The data has a decreasing trend.
The average number of yearly fire incidents per 10k residents in Pennsville, NJ compared to nearest cities:
(Note: Based on data for the last 3 years, including only cities with population 5,000 and above)
| Pennsville: | 28.3 |
| Carneys Point: | 32.5 |
| Penns Grove: | 77.9 |
| Paulsboro: | 76.8 |
 The median response time based on all reported fire incidents is 7 minutes. This is higher compared to the state median value.
The median response time in Pennsville, NJ compared to nearest cities:
(Note: Based on data for all years, including only cities with at least 500 fire incidents)
| Pennsville: | 7 minutes |
| New Castle: | 7 minutes |
| Carneys Point: | 9 minutes |
| Penns Grove: | 9 minutes |
| Salem: | 7 minutes |
| Wilmington: | 6 minutes |
| Delaware City: | 8 minutes |
| Bear: | 9 minutes |
| Claymont: | 6 minutes |
 34.9% incidents where reported in the morning and 65.1% in the evening. The most fires (16.2%) took place on Saturday, and the least (12.8%) on Thursday.
 Based on the 1,184 fires from years 2003 - 2018 most fires (11.8%) took place during February, and the least (6.1%) in July.
 Out of all 3,593 cases reported during the years 2003 - 2018, the most belonged to the categories: Fire (33.0%), Good Intent Call (18.7%), and Hazardous Condition (16.5%).
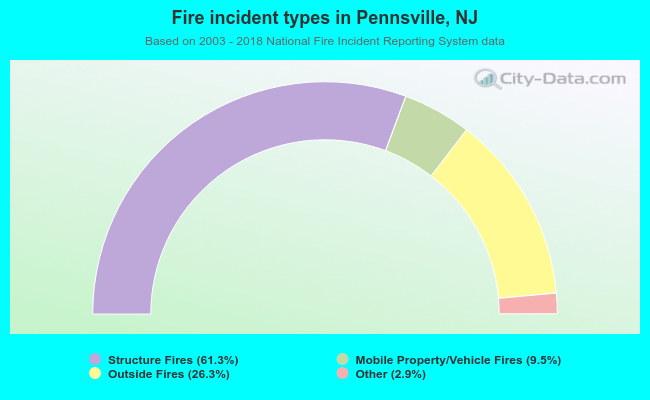 When looking into fire subcategories, the most incidents belonged to: Structure Fires (61.3%), and Outside Fires (26.3%).