Carneys Point: Fire Incidents, New Jersey (NJ)
Where are fire incidents reported in Carneys Point, NJ
Something went wrong! Please refresh the page.
| Fire incidents reported | |
|---|---|
| Sreet name | Count |
| SHELL RD | 126 |
| BROAD ST | 78 |
| PENNS GROVE-AUBURN RD | 52 |
| PENNSVILLE-AUBRN RD | 48 |
| INTERSTATE 295 | 42 |
| NEW JERSEY TURNPIKE TPKE | 40 |
| DEEPWATER SLAPES CORNER RD | 38 |
| GOLFWOOD AVE | 36 |
| QUILLYTOWN RD | 34 |
| RTE 40 | 34 |
| DUPONT RD | 32 |
| MERION AVE | 32 |
| PENNSVILLE AUBURN RD | 30 |
| DIXIE DR | 28 |
| INTERSTATE 295 HWY | 28 |
| VIRGINIA AVE | 24 |
| VIRGINA AVE | 22 |
| PLANT RD | 20 |
| GARY AVE | 18 |
| IVES AVE | 18 |
| 5TH AVE | 16 |
| SODERS RD | 16 |
| 6TH AVE | 14 |
| COURSES LANDING RD | 14 |
| HARDING HWY | 14 |
| I ST | 14 |
| PENNS GROVE AUBURN RD | 14 |
| BROAD ST | 12 |
| E ST | 12 |
| QUILLEYTOWN RD | 12 |
2003 - 2018 National Fire Incident Reporting System (NFIRS) incidents
- Incident types reported to NFIRS in Carneys Point, NJ
- 84547.2%Fire
- 28515.9%Hazardous Condition
- 26614.9%Rescue & EMS
- 22912.8%Good Intent Call
- 1448.0%False Alarm
- 191.1%Service Call
- 20.1%Severe Weather
- Fire incident types reported to NFIRS in Carneys Point, NJ
- 46354.8%Structure Fires
- 20324.0%Outside Fires
- 15618.5%Mobile Property/Vehicle Fires
- 232.7%Other
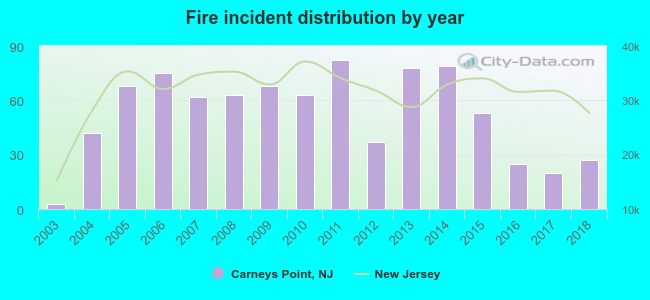 Based on the data from the years 2003 - 2018 the average number of fires per year is 53. The highest number of reported fire incidents - 82 took place in 2011, and the least - 3 in 2003. The data has an increasing trend.
The average number of yearly fire incidents per 10k residents in Carneys Point, NJ compared to nearest cities:
(Note: Based on data for the last 3 years, including only cities with population 5,000 and above)
| Carneys Point: | 32.5 |
| Penns Grove: | 77.9 |
| Pennsville: | 28.3 |
| Paulsboro: | 76.8 |
 The median response time based on all reported fire incidents is 9 minutes. This is higher compared to the state median value.
The median response time in Carneys Point, NJ compared to nearest cities:
(Note: Based on data for all years, including only cities with at least 500 fire incidents)
| Carneys Point: | 9 minutes |
| Penns Grove: | 9 minutes |
| Pennsville: | 7 minutes |
| Wilmington: | 6 minutes |
| New Castle: | 7 minutes |
| Claymont: | 6 minutes |
| Salem: | 7 minutes |
| Delaware City: | 8 minutes |
| Hockessin: | 8 minutes |
 According to the data from the years 2003 - 2018 the average number of fire-related casualties per year is 0. The highest number of injuries - 3 took place in 2010, and the lowest - 0 in 2003. The data has a constant trend.
The average number of injuries per 1,000 fire incidents is 8. This indicator was the highest - 48 in 2010, and the lowest 0 in 2003. The trend for injuries per 1,000 incidents is constant. Compared to the New Jersey value the number of injuries per 1,000 incidents is about the same.
According to the data from the years 2003 - 2018 the average number of fire-related casualties per year is 0. The highest number of injuries - 3 took place in 2010, and the lowest - 0 in 2003. The data has a constant trend.
The average number of injuries per 1,000 fire incidents is 8. This indicator was the highest - 48 in 2010, and the lowest 0 in 2003. The trend for injuries per 1,000 incidents is constant. Compared to the New Jersey value the number of injuries per 1,000 incidents is about the same.Casualties per 1,000 incidents in Carneys Point, NJ compared to nearest cities:
(Note: Based on data for all years, including only cities with at least 500 fire incidents)
| Carneys Point: | 8.3 |
| Penns Grove: | 5.4 |
| Pennsville: | 0.0 |
| Wilmington: | 4.5 |
| New Castle: | 3.4 |
| Claymont: | 6.4 |
| Salem: | 6.0 |
| Delaware City: | 6.2 |
| Hockessin: | 1.3 |
 33.4% incidents where reported in the morning and 66.6% in the evening. The most fires (17.4%) took place on Sunday, and the least (12.3%) on Monday.
 According to the 845 incident reports from years 2003 - 2018 most fires (11.4%) took place during March, and the least (6.5%) in December.
 Out of all 1,791 cases reported during the years 2003 - 2018, the most belonged to the categories: Fire (47.2%), Hazardous Condition (15.9%), and Rescue & EMS (14.9%).
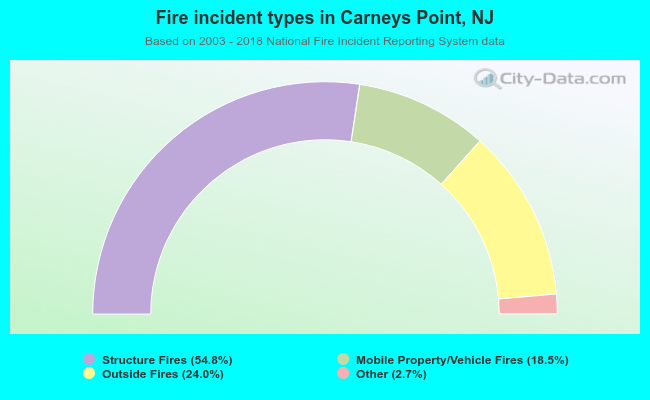 When looking into fire subcategories, the most reports belonged to: Structure Fires (54.8%), and Outside Fires (24.0%).