Peekskill: Fire Incidents, New York (NY)
Where are fire incidents reported in Peekskill, NY
Something went wrong! Please refresh the page.
|
| |||||||||||||||||||||||||||||||||||||||||||||||||||||||||||||||||||||||||||||||||||||||||||||||||||||||||||||
2002 - 2018 National Fire Incident Reporting System (NFIRS) incidents
- Incident types reported to NFIRS in Peekskill, NY
- 1,35425.8%Hazardous Condition
- 1,35225.8%Fire
- 1,06020.2%False Alarm
- 68113.0%Rescue & EMS
- 4578.7%Service Call
- 3236.2%Good Intent Call
- 90.2%Special Incident
- 70.1%Overpressure Rupture
- Fire incident types reported to NFIRS in Peekskill, NY
- 94670.0%Structure Fires
- 23117.1%Outside Fires
- 1138.4%Mobile Property/Vehicle Fires
- 624.6%Other
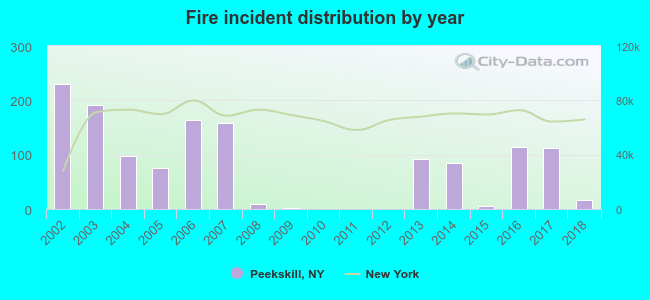 Based on the data from the years 2002 - 2018 the average number of fires per year is 80. The highest number of reported fire incidents - 230 took place in 2002, and the least - 0 in 2010. The data has a declining trend.
The average number of yearly fire incidents per 10k residents in Peekskill, NY compared to nearest cities:
(Note: Based on data for the last 3 years, including only cities with population 5,000 and above)
| Peekskill: | 33.7 |
| Cortlandt: | 11.1 |
| Stony Point: | 17.0 |
| Yorktown: | 11.7 |
| Haverstraw: | 40.0 |
| West Haverstraw: | 7.4 |
| Thiells: | 4.0 |
| Putnam Valley: | 23.4 |
| Philipstown: | 2.1 |
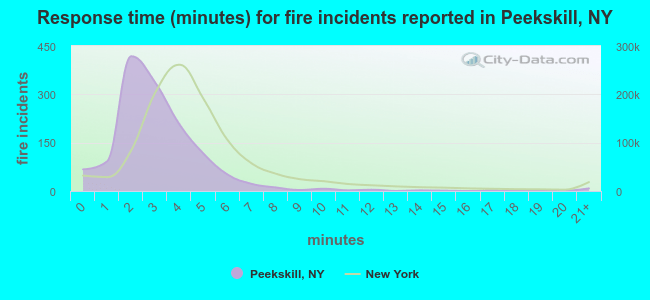 The median response time based on all reported fire incidents is 3 minutes. This is lower compared to the state median value.
The median response time in Peekskill, NY compared to nearest cities:
(Note: Based on data for all years, including only cities with at least 500 fire incidents)
| Peekskill: | 3 minutes |
| Cortlandt: | 7 minutes |
| Stony Point: | 4 minutes |
| Yorktown: | 6 minutes |
| Putnam Valley: | 8 minutes |
| Pomona: | 5 minutes |
| New City: | 4 minutes |
| Mahopac: | 7 minutes |
| Chappaqua: | 5 minutes |
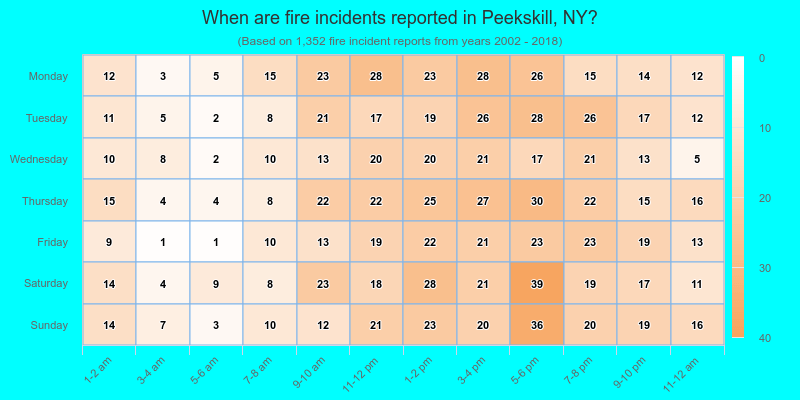
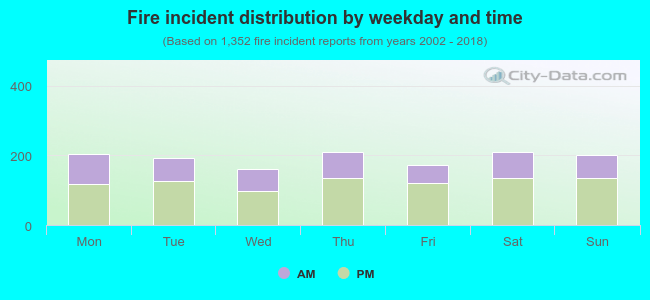 35.8% incidents where reported in the morning and 64.2% in the evening. The most fires (15.6%) took place on Saturday, and the least (11.8%) on Wednesday.
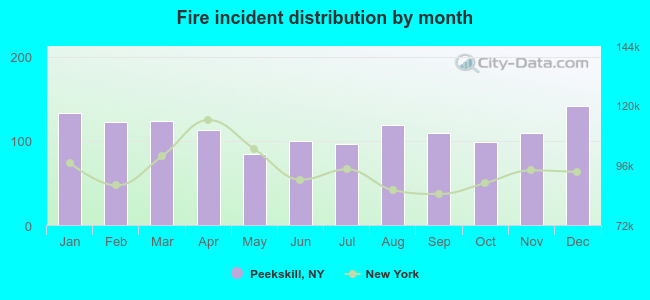 According to the 1,352 fire incidents from years 2002 - 2018 most fires (10.5%) took place during December, and the least (6.2%) in May.
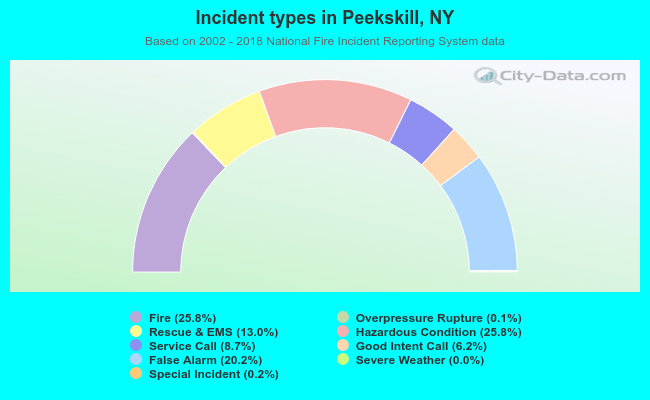 Out of all 5,244 cases reported during the years 2002 - 2018, the most belonged to the categories: Hazardous Condition (25.8%), Fire (25.8%), and False Alarm (20.2%).
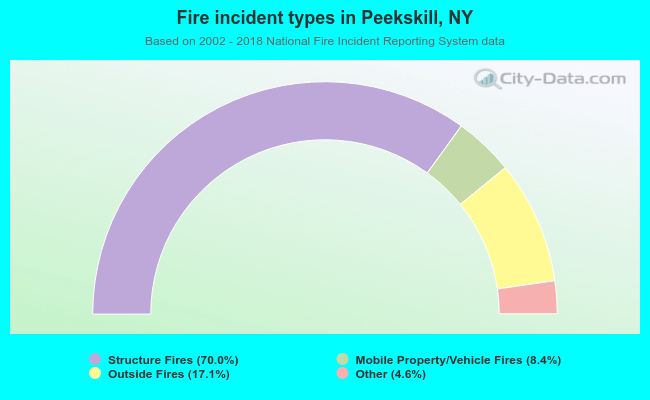 When looking into fire subcategories, the most reports belonged to: Structure Fires (70.0%), and Outside Fires (17.1%).