New City: Fire Incidents, New York (NY)
Where are fire incidents reported in New City, NY
Something went wrong! Please refresh the page.
| Fire incidents reported | |
|---|---|
| Sreet name | Count |
| S MAIN ST | 94 |
| N MAIN ST | 68 |
| NEW HEMPSTEAD RD | 66 |
| PHILLIPS HILL RD | 50 |
| WEST CLARKSTOWN RD | 48 |
| SOUTH MOUNTAIN RD | 44 |
| CONGERS RD | 40 |
| S LITTLE TOR RD | 36 |
| HERITAGE DR | 34 |
| BUENA VISTA RD | 28 |
| LAUREL RD | 28 |
| N LITTLE TOR RD | 26 |
| SQUADRON BLVD | 26 |
| STRAWTOWN RD | 26 |
| MAPLE AVE | 24 |
| SOUTH MAIN STREET | 24 |
| GERMONDS RD | 22 |
| NO MAIN ST | 22 |
| RED HILL RD | 22 |
| RIDGE RD | 22 |
| ROUTE 304 | 22 |
| SO MAIN ST | 20 |
| NEW HEMPSTEAD ROAD | 18 |
| OLD ROUTE 304 | 18 |
| WEST CLARKSTOWN ROAD | 18 |
| NORTH MAIN STREET | 16 |
| OLD SCHOOLHOUSE RD | 16 |
| ROBERTS RD | 16 |
| SUSAN DR | 16 |
| MULLER CT | 14 |
| Other | 600 |
2002 - 2018 National Fire Incident Reporting System (NFIRS) incidents
- Incident types reported to NFIRS in New City, NY
- 1,77528.7%Hazardous Condition
- 1,52424.6%Fire
- 1,34321.7%False Alarm
- 1,01616.4%Good Intent Call
- 3936.4%Service Call
- 1141.8%Rescue & EMS
- 140.2%Severe Weather
- 90.1%Overpressure Rupture
- Fire incident types reported to NFIRS in New City, NY
- 89058.4%Structure Fires
- 46430.4%Outside Fires
- 1429.3%Mobile Property/Vehicle Fires
- 281.8%Other
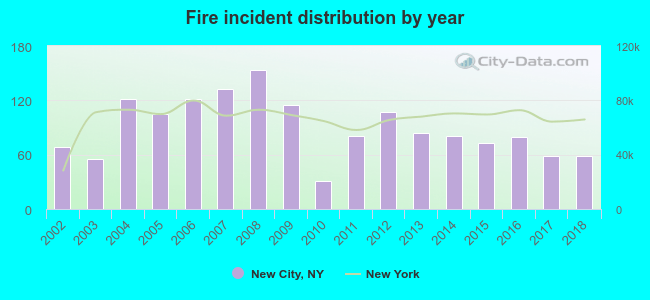 According to the data from the years 2002 - 2018 the average number of fire incidents per year is 90. The highest number of reported fire incidents - 153 took place in 2008, and the least - 31 in 2010. The data has a dropping trend.
The average number of yearly fire incidents per 10k residents in New City, NY compared to nearest cities:
(Note: Based on data for the last 3 years, including only cities with population 5,000 and above)
| New City: | 19.5 |
| New Square: | 16.5 |
| Hillcrest: | 7.5 |
| Congers: | 31.1 |
| New Hempstead: | 30.8 |
| Valley Cottage: | 30.4 |
| Spring Valley: | 13.7 |
| Nanuet: | 24.0 |
| Mount Ivy: | 1.5 |
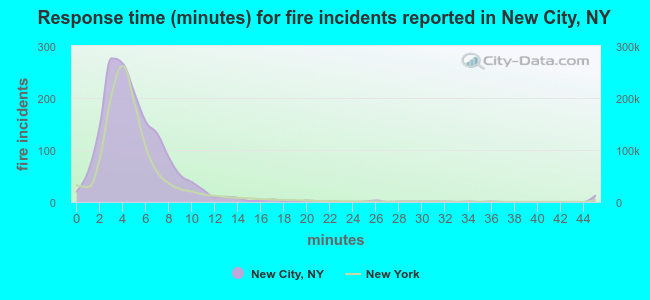 The median response time based on all reported fire incidents is 4 minutes. This is close to the New York median value.
The median response time in New City, NY compared to nearest cities:
(Note: Based on data for all years, including only cities with at least 500 fire incidents)
| New City: | 4 minutes |
| Spring Valley: | 5 minutes |
| Nanuet: | 5 minutes |
| Monsey: | 0 minutes |
| Pomona: | 5 minutes |
| Stony Point: | 4 minutes |
| Pearl River: | 4 minutes |
| Airmont: | 4 minutes |
| Orangeburg: | 3 minutes |
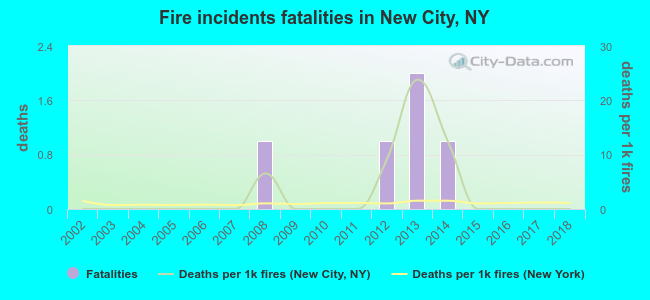 According to the reports from the years 2002 - 2018 the average number of fire-related fatalities per year is 0. The highest number of reported deaths - 2 took place in 2013, and the lowest - 0 in 2002. The data has a constant trend.
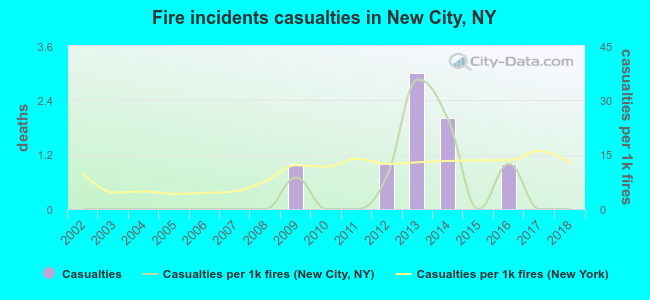 Based on the data from the years 2002 - 2018 the average number of fire-related casualties per year is 0. The highest number of reported injuries - 3 took place in 2013, and the lowest - 0 in 2002. The data has a constant trend.
The average number of injuries per 1,000 fire incidents is 5. This indicator was the highest - 36 in 2013, and the lowest 0 in 2002. The trend for injuries per 1,000 incidents is constant. Compared to the state value the number of casualties per 1,000 incidents is lower.
Based on the data from the years 2002 - 2018 the average number of fire-related casualties per year is 0. The highest number of reported injuries - 3 took place in 2013, and the lowest - 0 in 2002. The data has a constant trend.
The average number of injuries per 1,000 fire incidents is 5. This indicator was the highest - 36 in 2013, and the lowest 0 in 2002. The trend for injuries per 1,000 incidents is constant. Compared to the state value the number of casualties per 1,000 incidents is lower.Casualties per 1,000 incidents in New City, NY compared to nearest cities:
(Note: Based on data for all years, including only cities with at least 500 fire incidents)
| New City: | 5.2 |
| Spring Valley: | 3.0 |
| Nanuet: | 0.7 |
| Monsey: | 0.0 |
| Pomona: | 3.8 |
| Stony Point: | 3.1 |
| Pearl River: | 1.8 |
| Airmont: | 0.0 |
| Orangeburg: | 0.0 |
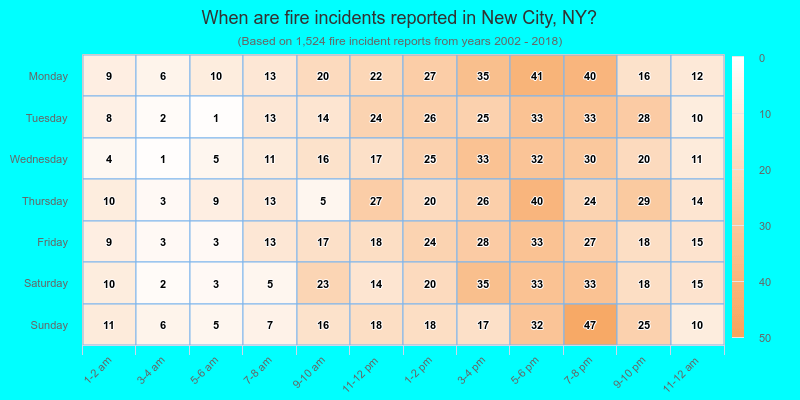
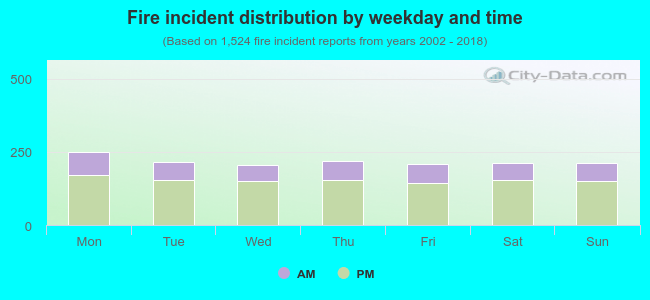 29.3% incidents where reported in the morning and 70.7% in the evening. The most fires (16.5%) took place on Monday, and the least (13.5%) on Wednesday.
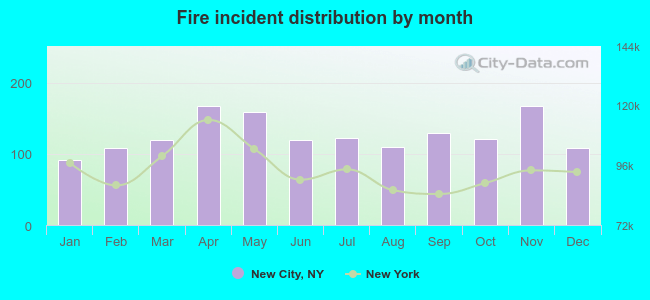 According to the 1,524 fire incident reports from years 2002 - 2018 most fires (11.0%) took place during April, and the least (6.0%) in January.
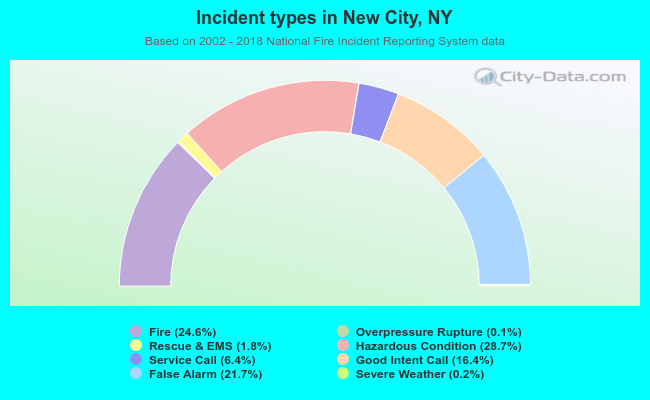 Out of all 6,188 cases reported during the years 2002 - 2018, the most belonged to the categories: Hazardous Condition (28.7%), Fire (24.6%), and False Alarm (21.7%).
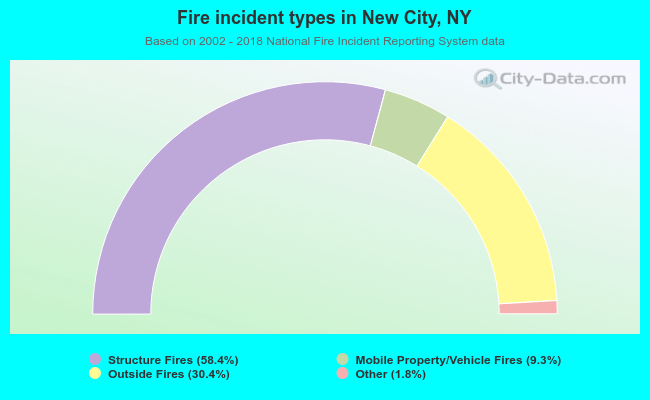 When looking into fire subcategories, the most reports belonged to: Structure Fires (58.4%), and Outside Fires (30.4%).