Pearl: Fire Incidents, Mississippi (MS)
Where are fire incidents reported in Pearl, MS
Something went wrong! Please refresh the page.
| Fire incidents reported | |
|---|---|
| Sreet name | Count |
| HWY 80 | 34 |
| OLD BRANDON | 34 |
| MONTEREY RD | 32 |
| PEARSON RD | 30 |
| OLD BRANDON ROAD | 26 |
| OLD BRANDON RD | 24 |
| HWY 468 | 20 |
| HWY 80 E | 20 |
| GREENFIELD RD | 18 |
| GREENFIELD RD | 18 |
| OLD BRANDON RD | 18 |
| 468 HWY | 16 |
| HIGHWAY 80 | 16 |
| HWY 80 EAST | 16 |
| OLD WHITFIELD RD | 16 |
| COLONY PARK DRIVE | 14 |
| HWY 80 E. | 14 |
| OLD WHITFIELD RD | 14 |
| CROSSPARK DRIVE | 12 |
| HENDERSON RD | 12 |
| HICKORY HILL PL | 12 |
| INTERSTATE 20 | 12 |
| MARY ANN | 12 |
| PEARSON | 12 |
| WALDEN POND | 12 |
| AIRPORT RD | 10 |
| FOX RUN TRL | 10 |
| GEORGE KERSH | 10 |
| HIGHWAY 80 EAST | 10 |
| I-20 EAST | 10 |
| Other | 1,012 |
2002 - 2018 National Fire Incident Reporting System (NFIRS) incidents
- Incident types reported to NFIRS in Pearl, MS
- 8,49670.3%Rescue & EMS
- 1,52612.6%Fire
- 6665.5%Hazardous Condition
- 5454.5%Good Intent Call
- 4753.9%False Alarm
- 2972.5%Service Call
- 330.3%Overpressure Rupture
- 330.3%Special Incident
- 150.1%Severe Weather
- Fire incident types reported to NFIRS in Pearl, MS
- 58738.5%Outside Fires
- 46730.6%Structure Fires
- 29719.5%Mobile Property/Vehicle Fires
- 17511.5%Other
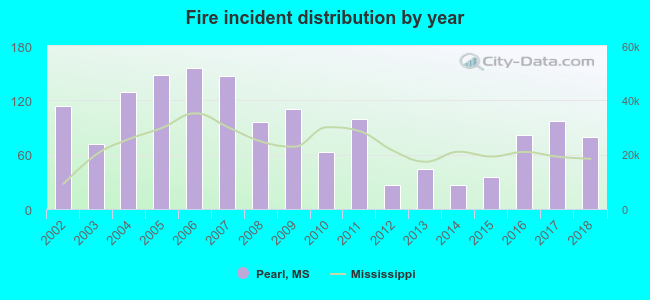 Based on the data from the years 2002 - 2018 the average number of fire incidents per year is 90. The highest number of reported fire incidents - 156 took place in 2006, and the least - 27 in 2012. The data has a decreasing trend.
The average number of yearly fire incidents per 10k residents in Pearl, MS compared to nearest cities:
(Note: Based on data for the last 3 years, including only cities with population 5,000 and above)
| Pearl: | 32.7 |
| Flowood: | 56.9 |
| Richland: | 54.7 |
| Brandon: | 99.6 |
| Jackson: | 25.9 |
| Ridgeland: | 34.4 |
| Byram: | 51.3 |
| Madison: | 40.1 |
| Clinton: | 27.8 |
 The median response time based on all reported fire incidents is 4 minutes. This is lower compared to the Mississippi median value.
The median response time in Pearl, MS compared to nearest cities:
(Note: Based on data for all years, including only cities with at least 500 fire incidents)
| Pearl: | 4 minutes |
| Flowood: | 4 minutes |
| Richland: | 3 minutes |
| Brandon: | 7 minutes |
| Jackson: | 5 minutes |
| Florence: | 9 minutes |
| Ridgeland: | 4 minutes |
| Byram: | 5 minutes |
| Madison: | 5 minutes |
 Based on the reports from the years 2002 - 2018 the average number of fire-related yearly casualties is 0. The highest number of casualties - 1 took place in 2010, and the lowest - 0 in 2002. The data has a constant trend.
The average number of casualties per 1,000 fire incidents is 2. This indicator was the highest - 16 in 2010, and the lowest 0 in 2002. The trend for casualties per 1,000 fire incidents is constant. Compared to the Mississippi value the number of injuries per 1,000 fire incidents is lower.
Based on the reports from the years 2002 - 2018 the average number of fire-related yearly casualties is 0. The highest number of casualties - 1 took place in 2010, and the lowest - 0 in 2002. The data has a constant trend.
The average number of casualties per 1,000 fire incidents is 2. This indicator was the highest - 16 in 2010, and the lowest 0 in 2002. The trend for casualties per 1,000 fire incidents is constant. Compared to the Mississippi value the number of injuries per 1,000 fire incidents is lower.
 30.2% incidents where reported in the morning and 69.8% in the evening. The most fires (15.9%) took place on Tuesday, and the least (11.7%) on Wednesday.
 According to the 1,526 fires from years 2002 - 2018 most fires (10.4%) took place during March, and the least (6.4%) in September.
 Out of all 12,086 cases reported during the years 2002 - 2018, the most belonged to the categories: Rescue & EMS (70.3%), Fire (12.6%), and Hazardous Condition (5.5%).
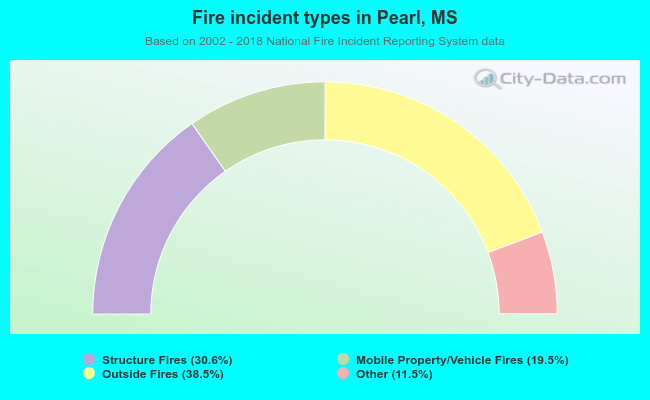 When looking into fire subcategories, the most incidents belonged to: Outside Fires (38.5%), and Structure Fires (30.6%).