Jackson: Fire Incidents, Mississippi (MS)
Where are fire incidents reported in Jackson, MS
Something went wrong! Please refresh the page.
| Fire incidents reported | |
|---|---|
| Sreet name | Count |
| RAYMOND RD | 252 |
| STATE ST | 216 |
| TERRY RD | 214 |
| NORTHSIDE DR | 208 |
| CAPITOL ST | 184 |
| MEDGAR EVERS BLVD | 168 |
| I55 N | 166 |
| US80 | 160 |
| BAILEY AVE | 148 |
| MCDOWELL RD | 138 |
| FLAG CHAPEL RD | 130 |
| ROBINSON ST | 114 |
| WOODROW WILSON AVE | 114 |
| ELLIS AVE | 110 |
| RIDGEWOOD RD | 104 |
| FOREST AVE | 98 |
| GALLATIN ST | 98 |
| CLINTON BLVD | 92 |
| I55 S | 88 |
| 49 HWY | 84 |
| SUNSET DR | 78 |
| PRENTISS ST | 72 |
| COUNTY LINE RD | 70 |
| WEST ST | 64 |
| ALBERMARLE RD | 62 |
| GALLATIN ST/I20 | 62 |
| BELVEDERE DR | 58 |
| COOPER RD | 56 |
| FARISH ST | 54 |
| OLD CANTON RD | 54 |
| Other | 6,589 |
2002 - 2018 National Fire Incident Reporting System (NFIRS) incidents
- Incident types reported to NFIRS in Jackson, MS
- 21,70543.7%Rescue & EMS
- 10,10520.3%Fire
- 6,20912.5%Hazardous Condition
- 6,17012.4%Good Intent Call
- 3,8627.8%False Alarm
- 1,4783.0%Service Call
- 750.2%Special Incident
- Fire incident types reported to NFIRS in Jackson, MS
- 4,18141.4%Structure Fires
- 3,26532.3%Outside Fires
- 2,36323.4%Mobile Property/Vehicle Fires
- 2962.9%Other
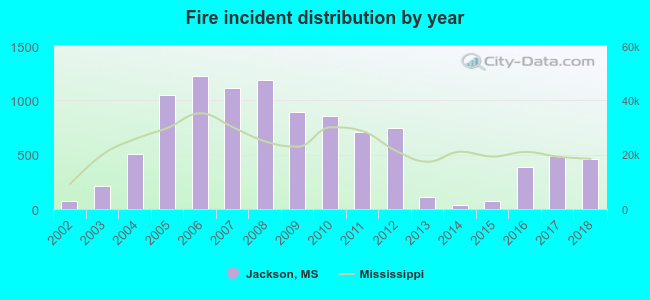 According to the data from the years 2002 - 2018 the average number of fire incidents per year is 594. The highest number of reported fire incidents - 1,225 took place in 2006, and the least - 34 in 2014. The data has a growing trend.
The average number of yearly fire incidents per 10k residents in Jackson, MS compared to nearest cities:
(Note: Based on data for the last 3 years, including only cities with population 5,000 and above)
| Jackson: | 25.9 |
| Flowood: | 56.9 |
| Pearl: | 32.7 |
| Richland: | 54.7 |
| Clinton: | 27.8 |
| Ridgeland: | 34.4 |
| Byram: | 51.3 |
| Madison: | 40.1 |
| Brandon: | 99.6 |
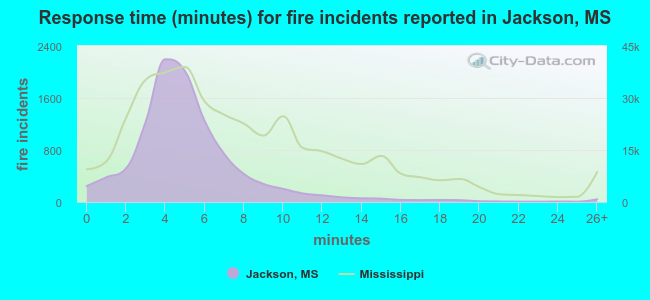 The median response time based on all reported fire incidents is 5 minutes. This is lower than the Mississippi median value.
The median response time in Jackson, MS compared to nearest cities:
(Note: Based on data for all years, including only cities with at least 500 fire incidents)
| Jackson: | 5 minutes |
| Flowood: | 4 minutes |
| Pearl: | 4 minutes |
| Richland: | 3 minutes |
| Clinton: | 5 minutes |
| Ridgeland: | 4 minutes |
| Byram: | 5 minutes |
| Madison: | 5 minutes |
| Brandon: | 7 minutes |
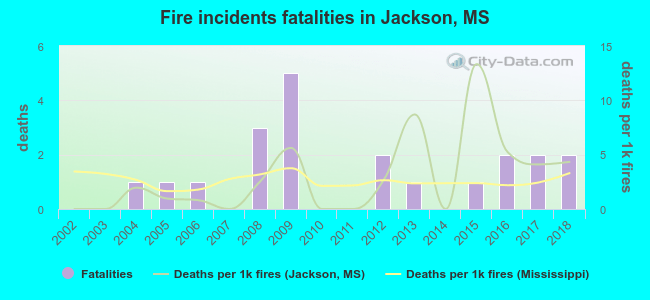 According to the data from the years 2002 - 2018 the average number of fire-related yearly deaths is 1. The highest number of deaths - 5 took place in 2009, and the lowest - 0 in 2002. The data has a rising trend.
The average number of fatalities per 1,000 fire incidents is 3. This indicator was the highest - 13 in 2015, and the lowest 0 in 2002. The trend for deaths per 1,000 fire incidents is increasing. Compared to the Mississippi value the number of deaths per 1,000 incidents is lower.
According to the data from the years 2002 - 2018 the average number of fire-related yearly deaths is 1. The highest number of deaths - 5 took place in 2009, and the lowest - 0 in 2002. The data has a rising trend.
The average number of fatalities per 1,000 fire incidents is 3. This indicator was the highest - 13 in 2015, and the lowest 0 in 2002. The trend for deaths per 1,000 fire incidents is increasing. Compared to the Mississippi value the number of deaths per 1,000 incidents is lower.Deaths per 1,000 incidents in Jackson, MS compared to nearest cities:
(Note: Based on data for all years, including only cities with at least 2,500 fire incidents)
| Jackson: | 2.1 |
| Brandon: | 1.5 |
| Canton: | 1.2 |
| Vicksburg: | 4.2 |
| Carthage: | 1.9 |
| Brookhaven: | 0.3 |
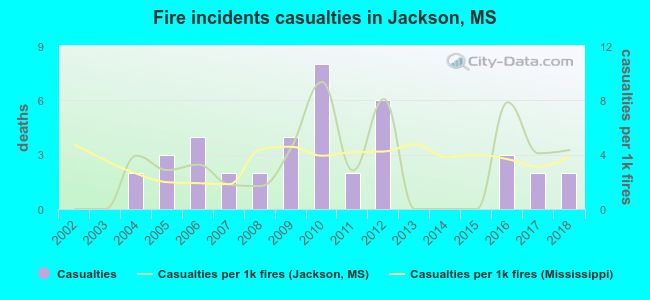 Based on the data from the years 2002 - 2018 the average number of fire-related casualties per year is 2. The highest number of reported casualties - 8 took place in 2010, and the lowest - 0 in 2002. The data has a rising trend.
The average number of injuries per 1,000 fire incidents is 3. This indicator was the highest - 9 in 2010, and the lowest 0 in 2002. The trend for casualties per 1,000 fire incidents is rising. Compared to the Mississippi value the number of casualties per 1,000 fires is similar.
Based on the data from the years 2002 - 2018 the average number of fire-related casualties per year is 2. The highest number of reported casualties - 8 took place in 2010, and the lowest - 0 in 2002. The data has a rising trend.
The average number of injuries per 1,000 fire incidents is 3. This indicator was the highest - 9 in 2010, and the lowest 0 in 2002. The trend for casualties per 1,000 fire incidents is rising. Compared to the Mississippi value the number of casualties per 1,000 fires is similar.
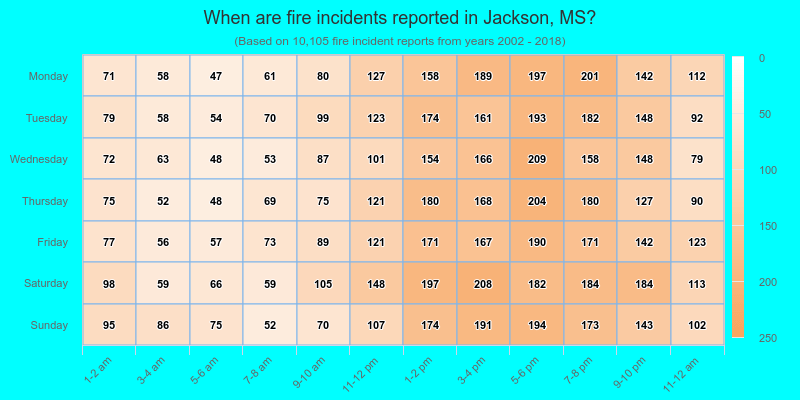
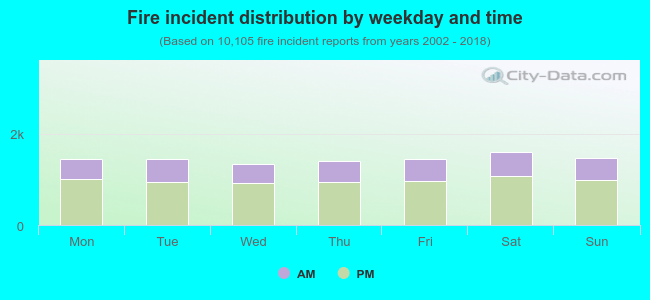 32.5% incidents where reported in the morning and 67.5% in the evening. The most fires (15.9%) took place on Saturday, and the least (13.2%) on Wednesday.
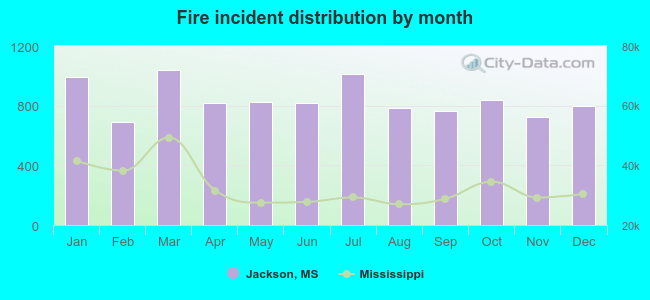 According to the 10,105 fire incidents from years 2002 - 2018 most fires (10.3%) took place during March, and the least (6.8%) in February.
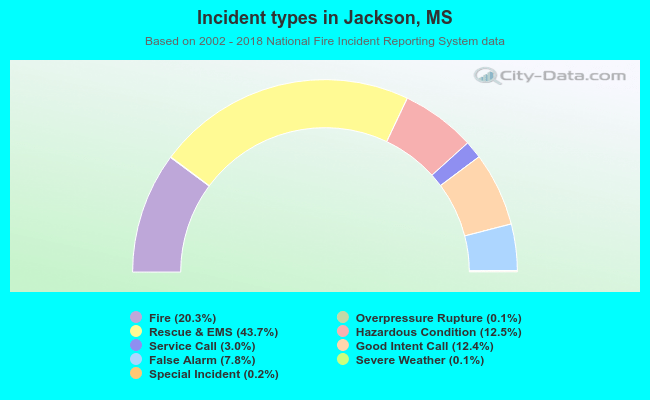 Out of all 49,681 cases reported during the years 2002 - 2018, the most belonged to the categories: Rescue & EMS (43.7%), Fire (20.3%), and Hazardous Condition (12.5%).
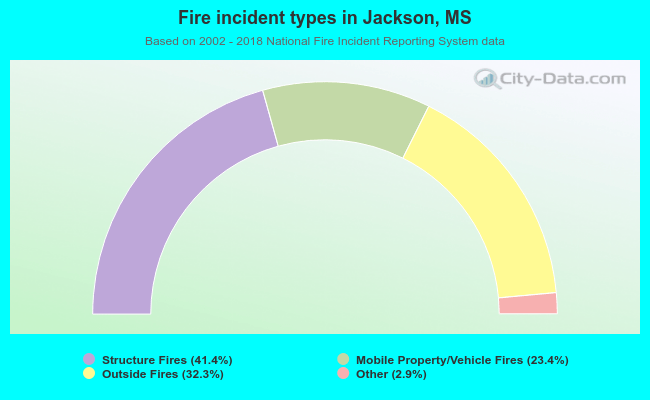 When looking into fire subcategories, the most incidents belonged to: Structure Fires (41.4%), and Outside Fires (32.3%).