Ozark: Fire Incidents, Missouri (MO)
Where are fire incidents reported in Ozark, MO
Something went wrong! Please refresh the page.
| Fire incidents reported | |
|---|---|
| Sreet name | Count |
| HWY 65 | 104 |
| HWY W | 64 |
| HWY NN | 60 |
| JACKSON | 60 |
| US HIGHWAY 65 | 58 |
| HWY 14 | 42 |
| HWY JJ | 42 |
| STATE HIGHWAY W | 40 |
| 20TH ST | 36 |
| LONGVIEW | 36 |
| CENTER RD | 34 |
| HWY 125 | 32 |
| 22ND ST | 30 |
| STATE HIGHWAY NN | 30 |
| 11TH ST. | 28 |
| MCCRACKEN | 28 |
| PRAIRIE HOLLOW RD | 28 |
| SOUTH ST | 28 |
| 16TH ST. | 26 |
| HARTLEY | 26 |
| WARREN | 26 |
| 16TH ST | 24 |
| HWY J | 24 |
| PARKVIEW | 24 |
| RIVERDALE RD | 24 |
| RIVERSIDE RD | 24 |
| SMYRNA RD | 24 |
| 14TH ST. | 22 |
| 20TH ST | 22 |
| 21ST ST | 22 |
| Other | 1,883 |
2002 - 2018 National Fire Incident Reporting System (NFIRS) incidents
- Incident types reported to NFIRS in Ozark, MO
- 8,06152.3%Rescue & EMS
- 2,95119.2%Fire
- 1,64410.7%Good Intent Call
- 1,2007.8%Service Call
- 8745.7%Hazardous Condition
- 6384.1%False Alarm
- 170.1%Severe Weather
- Fire incident types reported to NFIRS in Ozark, MO
- 1,53552.0%Outside Fires
- 1,00734.1%Structure Fires
- 30910.5%Mobile Property/Vehicle Fires
- 1003.4%Other
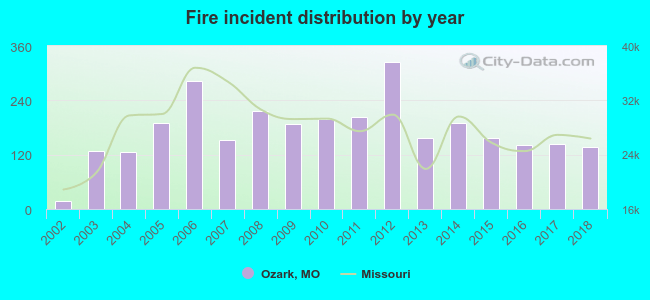 According to the data from the years 2002 - 2018 the average number of fires per year is 174. The highest number of fire incidents - 325 took place in 2012, and the least - 18 in 2002. The data has a rising trend.
The average number of yearly fire incidents per 10k residents in Ozark, MO compared to nearest cities:
(Note: Based on data for the last 3 years, including only cities with population 5,000 and above)
| Ozark: | 74.5 |
| Nixa: | 43.6 |
| Battlefield: | 47.3 |
| Springfield: | 62.5 |
| Republic: | 40.2 |
| Willard: | 113.1 |
| Branson: | 115.5 |
| Marshfield: | 109.9 |
| Aurora: | 23.3 |
 The median response time based on all reported fire incidents is 8 minutes. This is higher than the state median value.
The median response time in Ozark, MO compared to nearest cities:
(Note: Based on data for all years, including only cities with at least 500 fire incidents)
| Ozark: | 8 minutes |
| Nixa: | 6 minutes |
| Rogersville: | 8 minutes |
| Battlefield: | 6 minutes |
| Springfield: | 5 minutes |
| Clever: | 11 minutes |
| Republic: | 4 minutes |
| Strafford: | 9 minutes |
| Galena: | 13 minutes |
 According to the reports from the years 2002 - 2018 the average number of fire-related yearly casualties is 0. The highest number of injuries - 1 took place in 2006, and the lowest - 0 in 2002. The data has a constant trend.
The average number of injuries per 1,000 fires is 1. This indicator was the highest - 7 in 2007, and the lowest 0 in 2002. The trend for injuries per 1,000 incidents is constant. Compared to the Missouri value the number of casualties per 1,000 incidents is much lower.
According to the reports from the years 2002 - 2018 the average number of fire-related yearly casualties is 0. The highest number of injuries - 1 took place in 2006, and the lowest - 0 in 2002. The data has a constant trend.
The average number of injuries per 1,000 fires is 1. This indicator was the highest - 7 in 2007, and the lowest 0 in 2002. The trend for injuries per 1,000 incidents is constant. Compared to the Missouri value the number of casualties per 1,000 incidents is much lower.Casualties per 1,000 incidents in Ozark, MO compared to nearest cities:
(Note: Based on data for all years, including only cities with at least 500 fire incidents)
| Ozark: | 1.4 |
| Nixa: | 4.9 |
| Rogersville: | 3.5 |
| Battlefield: | 7.1 |
| Springfield: | 14.2 |
| Clever: | 0.0 |
| Republic: | 6.9 |
| Strafford: | 0.0 |
| Galena: | 3.3 |
 26.3% incidents where reported in the morning and 73.7% in the evening. The most fires (15.0%) took place on Saturday, and the least (13.3%) on Thursday.
 Based on the 2,951 reports from years 2002 - 2018 most fires (11.8%) took place during March, and the least (6.1%) in May.
 Out of all 15,408 cases reported during the years 2002 - 2018, the most belonged to the categories: Rescue & EMS (52.3%), Fire (19.2%), and Good Intent Call (10.7%).
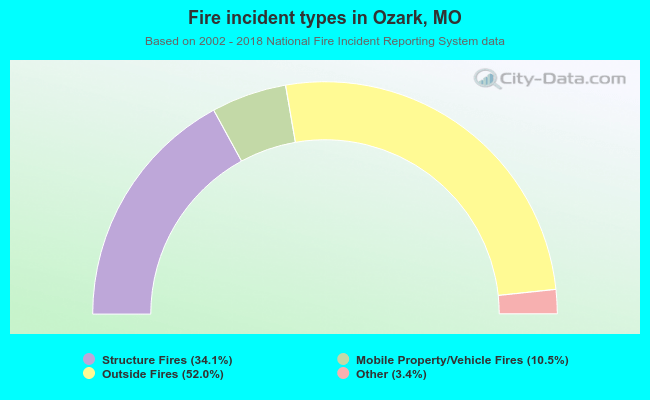 When looking into fire subcategories, the most incidents belonged to: Outside Fires (52.0%), and Structure Fires (34.1%).