Aurora: Fire Incidents, Missouri (MO)
Where are fire incidents reported in Aurora, MO
Something went wrong! Please refresh the page.
|
| |||||||||||||||||||||||||||||||||||||||||||||||||||||||||||||||||||||||||||||||||||||||||||||||||||||||||||||
| Other | 72 | |||||||||||||||||||||||||||||||||||||||||||||||||||||||||||||||||||||||||||||||||||||||||||||||||||||||||||||
2002 - 2018 National Fire Incident Reporting System (NFIRS) incidents
- Incident types reported to NFIRS in Aurora, MO
- 47884.0%Fire
- 376.5%Hazardous Condition
- 183.2%Good Intent Call
- 142.5%Rescue & EMS
- 101.8%Service Call
- 101.8%False Alarm
- 10.2%Overpressure Rupture
- 10.2%Special Incident
- Fire incident types reported to NFIRS in Aurora, MO
- 26755.9%Structure Fires
- 13027.2%Outside Fires
- 439.0%Other
- 387.9%Mobile Property/Vehicle Fires
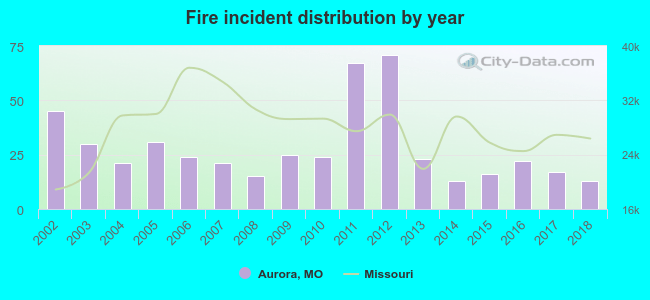 According to the data from the years 2002 - 2018 the average number of fires per year is 28. The highest number of fire incidents - 71 took place in 2012, and the least - 13 in 2014. The data has a declining trend.
The average number of yearly fire incidents per 10k residents in Aurora, MO compared to nearest cities:
(Note: Based on data for the last 3 years, including only cities with population 5,000 and above)
| Aurora: | 23.3 |
| Monett: | 31.7 |
| Republic: | 40.2 |
| Battlefield: | 47.3 |
| Nixa: | 43.6 |
| Willard: | 113.1 |
| Ozark: | 74.5 |
| Springfield: | 62.5 |
| Branson: | 115.5 |
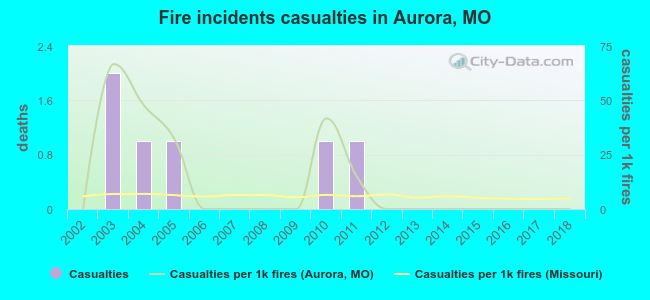 According to the data from the years 2002 - 2018 the average number of fire-related yearly casualties is 0. The highest number of injuries - 2 took place in 2003, and the lowest - 0 in 2002. The data has a constant trend.
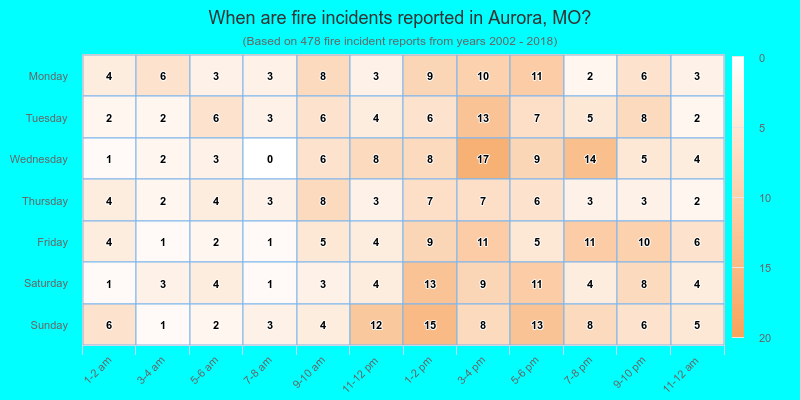
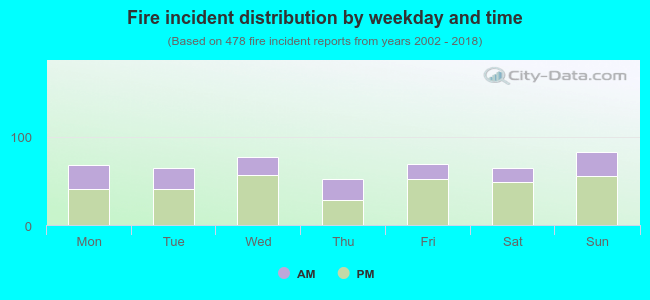 32.4% incidents where reported in the morning and 67.6% in the evening. The most fires (17.4%) took place on Sunday, and the least (10.9%) on Thursday.
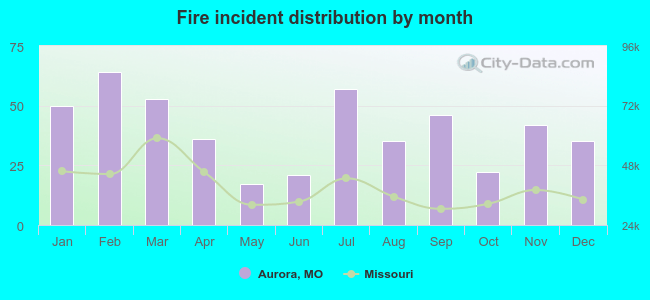 Based on the 478 fires from years 2002 - 2018 most fires (13.4%) took place during February, and the least (3.6%) in May.
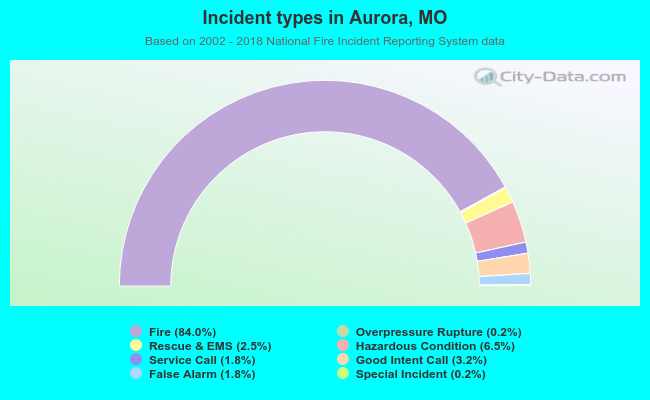 Out of all 569 cases reported during the years 2002 - 2018, the most belonged to the categories: Fire (84.0%), Hazardous Condition (6.5%), and Good Intent Call (3.2%).
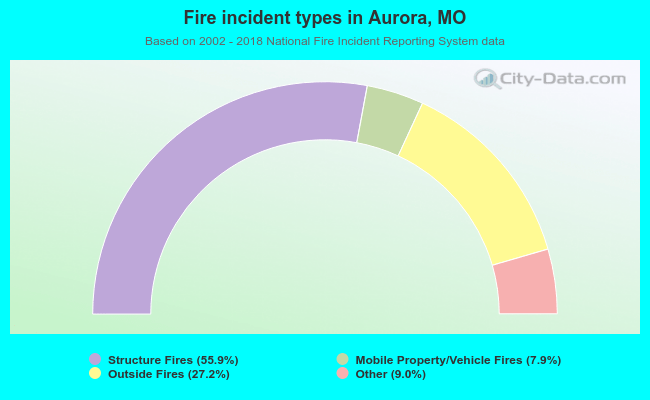 When looking into fire subcategories, the most reports belonged to: Structure Fires (55.9%), and Outside Fires (27.2%).