Norfolk: Fire Incidents, Massachusetts (MA)
Where are fire incidents reported in Norfolk, MA
Something went wrong! Please refresh the page.
| Fire incidents reported | |
|---|---|
| Sreet name | Count |
| MEETINGHOUSE LN | 286 |
| MAIN ST | 126 |
| MEETING HOUSE RD | 82 |
| CLARK ST | 72 |
| NORTH ST | 60 |
| DEDHAM ST | 38 |
| KING ST | 38 |
| MYRTLE ST | 38 |
| PINE ST | 36 |
| ROCKWOOD RD | 36 |
| UNION ST | 36 |
| SEEKONK ST | 34 |
| HILLCREST VILLAGE | 32 |
| MEDWAY ST | 30 |
| LIBERTY LN | 24 |
| BOARDMAN ST | 22 |
| HOLBROOK ST | 22 |
| BERKSHIRE RD | 20 |
| INDUSTRIES WY | 20 |
| NORTH STREET | 20 |
| PARK ST | 20 |
| BARNSTABLE RD | 18 |
| GROVE ST | 18 |
| MEDWAY BRANCH | 18 |
| CLEVELAND ST | 16 |
| LAWRENCE ST | 16 |
| FRUIT ST | 14 |
| MAIN STREET | 14 |
| SWEETLAND FARM RD | 14 |
| TUCKER RD | 14 |
2002 - 2018 National Fire Incident Reporting System (NFIRS) incidents
- Incident types reported to NFIRS in Norfolk, MA
- 3,78438.5%Hazardous Condition
- 3,54136.0%Rescue & EMS
- 1,03010.5%False Alarm
- 1,00210.2%Fire
- 3443.5%Service Call
- 1201.2%Good Intent Call
- Fire incident types reported to NFIRS in Norfolk, MA
- 73072.9%Structure Fires
- 20420.4%Outside Fires
- 484.8%Mobile Property/Vehicle Fires
- 202.0%Other
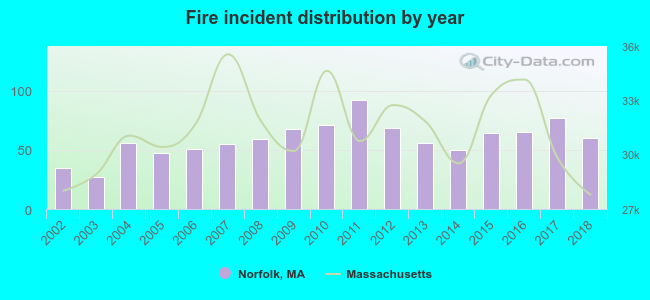 Based on the data from the years 2002 - 2018 the average number of fire incidents per year is 59. The highest number of reported fires - 92 took place in 2011, and the least - 27 in 2003. The data has a growing trend.
The average number of yearly fire incidents per 10k residents in Norfolk, MA compared to nearest cities:
(Note: Based on data for the last 3 years, including only cities with population 5,000 and above)
| Norfolk: | 60.0 |
| Wrentham: | 20.1 |
| Millis: | 6.3 |
| Franklin: | 22.5 |
| Walpole: | 123.4 |
| Foxborough: | 96.0 |
| Medfield: | 29.8 |
| Medway: | 42.1 |
| Plainville: | 44.0 |
 The median response time based on all reported fire incidents is 3 minutes. This is lower than the state median value.
The median response time in Norfolk, MA compared to nearest cities:
(Note: Based on data for all years, including only cities with at least 500 fire incidents)
| Norfolk: | 3 minutes |
| Wrentham: | 2 minutes |
| Franklin: | 6 minutes |
| Walpole: | 3 minutes |
| Foxborough: | 5 minutes |
| Plainville: | 4 minutes |
| Sharon: | 5 minutes |
| Bellingham: | 7 minutes |
| Norwood: | 4 minutes |
 Based on the data from the years 2002 - 2018 the average number of fire-related casualties per year is 1. The highest number of casualties - 5 took place in 2010, and the lowest - 0 in 2002. The data has a constant trend.
The average number of casualties per 1,000 fires is 14. This indicator was the highest - 70 in 2010, and the lowest 0 in 2002. The trend for casualties per 1,000 fires is growing. Compared to the state value the number of injuries per 1,000 incidents is higher.
Based on the data from the years 2002 - 2018 the average number of fire-related casualties per year is 1. The highest number of casualties - 5 took place in 2010, and the lowest - 0 in 2002. The data has a constant trend.
The average number of casualties per 1,000 fires is 14. This indicator was the highest - 70 in 2010, and the lowest 0 in 2002. The trend for casualties per 1,000 fires is growing. Compared to the state value the number of injuries per 1,000 incidents is higher.Casualties per 1,000 incidents in Norfolk, MA compared to nearest cities:
(Note: Based on data for all years, including only cities with at least 500 fire incidents)
| Norfolk: | 15.0 |
| Wrentham: | 0.0 |
| Franklin: | 3.0 |
| Walpole: | 12.4 |
| Foxborough: | 5.5 |
| Plainville: | 7.6 |
| Sharon: | 9.8 |
| Bellingham: | 12.0 |
| Norwood: | 9.7 |
 28.7% incidents where reported in the morning and 71.3% in the evening. The most fires (15.5%) took place on Friday, and the least (13.5%) on Monday.
 According to the 1,002 incident reports from years 2002 - 2018 most fires (14.9%) took place during April, and the least (6.2%) in June.
 Out of all 9,830 cases reported during the years 2002 - 2018, the most belonged to the categories: Rescue & EMS (38.5%), Overpressure Rupture (36.0%), and Good Intent Call (10.5%).
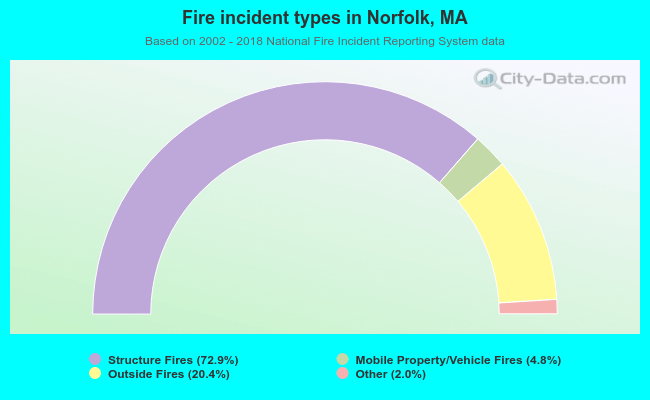 When looking into fire subcategories, the most reports belonged to: Structure Fires (72.9%), and Outside Fires (20.4%).