Millis: Fire Incidents, Massachusetts (MA)
Where are fire incidents reported in Millis, MA
Something went wrong! Please refresh the page.
|
| |||||||||||||||||||||||||||||||||||||||||||||||||||||||||||||||||||||||||||||||||||||||||||||||||||||||||||||
2002 - 2018 National Fire Incident Reporting System (NFIRS) incidents
- Incident types reported to NFIRS in Millis, MA
- 37572.0%Rescue & EMS
- 10019.2%Fire
- 183.5%Service Call
- 132.5%Hazardous Condition
- 122.3%Good Intent Call
- 20.4%False Alarm
- 10.2%Special Incident
- Fire incident types reported to NFIRS in Millis, MA
- 8080.0%Structure Fires
- 99.0%Mobile Property/Vehicle Fires
- 88.0%Outside Fires
- 33.0%Other
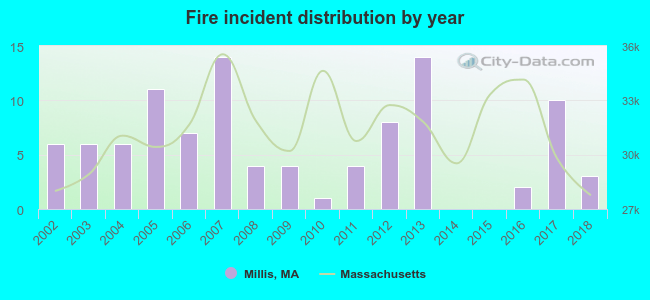 Based on the data from the years 2002 - 2018 the average number of fire incidents per year is 6. The highest number of reported fires - 14 took place in 2007, and the least - 0 in 2014. The data has a dropping trend.
The average number of yearly fire incidents per 10k residents in Millis, MA compared to nearest cities:
(Note: Based on data for the last 3 years, including only cities with population 5,000 and above)
| Millis: | 6.3 |
| Medfield: | 29.8 |
| Medway: | 42.1 |
| Norfolk: | 60.0 |
| Holliston: | 5.2 |
| Franklin: | 22.5 |
| Walpole: | 123.4 |
| Wrentham: | 20.1 |
| Ashland: | 30.1 |

 52.0% incidents where reported in the morning and 48.0% in the evening. The most fires (21.0%) took place on Friday, and the least (8.0%) on Tuesday.
 According to the 100 reports from years 2002 - 2018 most fires (17.0%) took place during April, and the least (0.0%) in September.
 Out of all 521 cases reported during the years 2002 - 2018, the most belonged to the categories: Overpressure Rupture (72.0%), Fire (19.2%), and Hazardous Condition (3.5%).
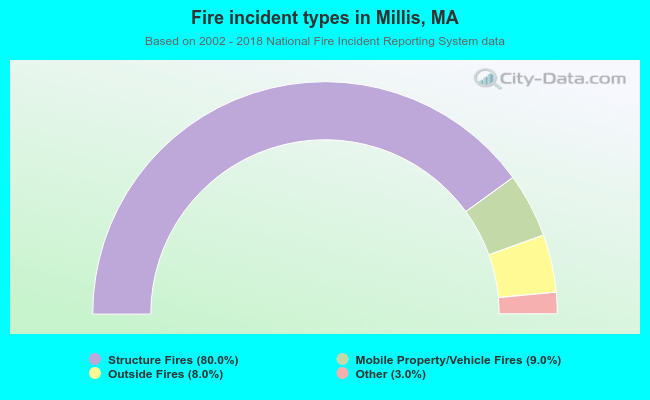 When looking into fire subcategories, the most reports belonged to: Structure Fires (80.0%), and Mobile Property/Vehicle Fires (9.0%).