Niles: Fire Incidents, Michigan (MI)
Where are fire incidents reported in Niles, MI
Something went wrong! Please refresh the page.
| Fire incidents reported | |
|---|---|
| Sreet name | Count |
| 11TH ST | 114 |
| 11TH | 86 |
| US 12 | 86 |
| BERTRAND | 78 |
| 3RD ST | 66 |
| MAIN ST | 64 |
| 13TH ST | 62 |
| 5TH ST | 58 |
| 13TH | 52 |
| CASS | 46 |
| BERTRAND RD | 44 |
| MAYFLOWER | 42 |
| ONTARIO RD | 40 |
| BARRON LAKE RD | 36 |
| ONTARIO | 36 |
| REUM RD | 36 |
| 5TH | 34 |
| MAIN | 34 |
| OAK ST | 34 |
| REDFIELD ST | 34 |
| BOND ST | 32 |
| BROADWAY | 32 |
| LAKE ST | 32 |
| 4TH ST | 30 |
| DETROIT RD | 30 |
| FERRY ST | 30 |
| IRONWOOD | 28 |
| PORTAGE | 28 |
| STATELINE RD | 28 |
| BELL RD | 26 |
| Other | 1,369 |
2002 - 2018 National Fire Incident Reporting System (NFIRS) incidents
- Incident types reported to NFIRS in Niles, MI
- 4,27932.7%Rescue & EMS
- 2,74721.0%Fire
- 2,44118.7%Hazardous Condition
- 1,38510.6%Service Call
- 1,1118.5%Good Intent Call
- 6805.2%False Alarm
- 3532.7%Special Incident
- 570.4%Overpressure Rupture
- 180.1%Severe Weather
- Fire incident types reported to NFIRS in Niles, MI
- 1,42952.0%Structure Fires
- 79528.9%Outside Fires
- 43916.0%Mobile Property/Vehicle Fires
- 843.1%Other
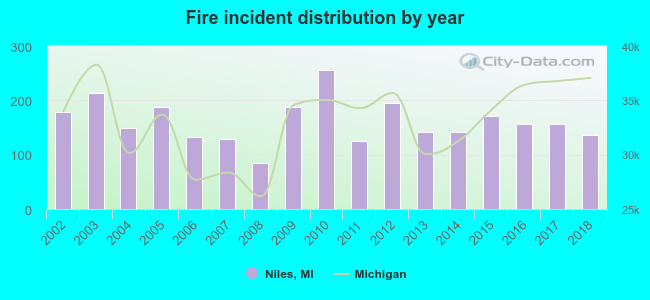 According to the data from the years 2002 - 2018 the average number of fire incidents per year is 162. The highest number of reported fires - 255 took place in 2010, and the least - 84 in 2008. The data has a declining trend.
The average number of yearly fire incidents per 10k residents in Niles, MI compared to nearest cities:
(Note: Based on data for the last 3 years, including only cities with population 5,000 and above)
| Niles: | 131.9 |
| Dowagiac: | 121.2 |
| Benton Harbor: | 216.3 |
| Three Rivers: | 23.2 |
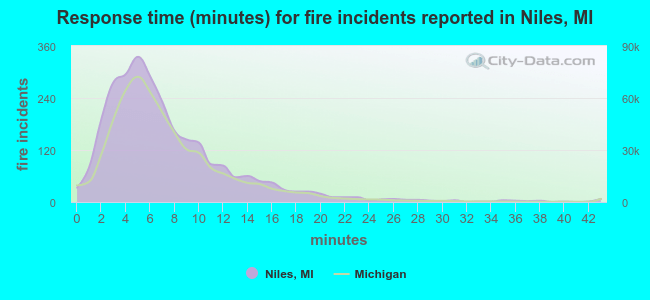 The median response time based on all reported fire incidents is 6 minutes. This is about the same as the state median value.
The median response time in Niles, MI compared to nearest cities:
(Note: Based on data for all years, including only cities with at least 500 fire incidents)
| Niles: | 6 minutes |
| Buchanan: | 9 minutes |
| Granger: | 6 minutes |
| Edwardsburg: | 11 minutes |
| Notre Dame: | 2 minutes |
| Berrien Springs: | 10 minutes |
| South Bend: | 5 minutes |
| Mishawaka: | 5 minutes |
| Dowagiac: | 8 minutes |
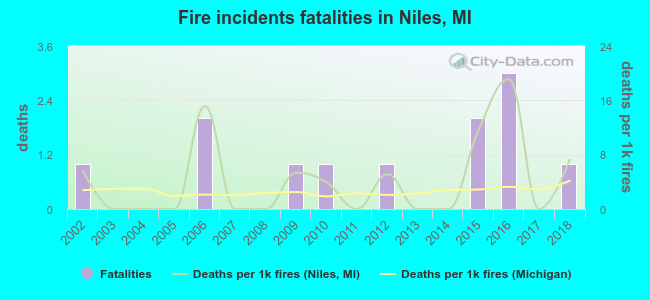 Based on the reports from the years 2002 - 2018 the average number of fire-related yearly deaths is 1. The highest number of deaths - 3 took place in 2016, and the lowest - 0 in 2003. The data has a constant trend.
The average number of fatalities per 1,000 fire incidents is 4. This indicator was the highest - 19 in 2016, and the lowest 0 in 2003. The trend for fatalities per 1,000 fire incidents is rising. Compared to the state value the number of deaths per 1,000 fires is higher.
Based on the reports from the years 2002 - 2018 the average number of fire-related yearly deaths is 1. The highest number of deaths - 3 took place in 2016, and the lowest - 0 in 2003. The data has a constant trend.
The average number of fatalities per 1,000 fire incidents is 4. This indicator was the highest - 19 in 2016, and the lowest 0 in 2003. The trend for fatalities per 1,000 fire incidents is rising. Compared to the state value the number of deaths per 1,000 fires is higher.Deaths per 1,000 incidents in Niles, MI compared to nearest cities:
(Note: Based on data for all years, including only cities with at least 2,500 fire incidents)
| Niles: | 4.4 |
| South Bend: | 0.6 |
| Elkhart: | 2.8 |
| Benton Harbor: | 3.3 |
| Goshen: | 0.0 |
| Michigan City: | 1.9 |
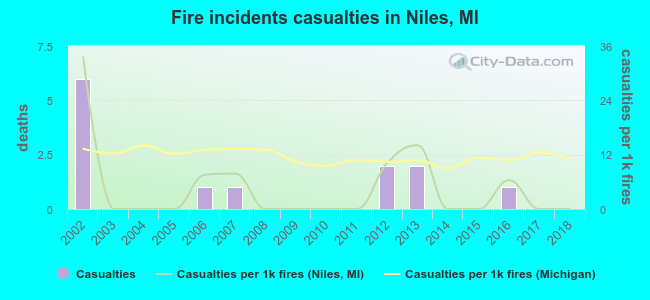 Based on the reports from the years 2002 - 2018 the average number of fire-related casualties per year is 1. The highest number of reported casualties - 6 took place in 2002, and the lowest - 0 in 2003. The data has a declining trend.
The average number of injuries per 1,000 fire incidents is 5. This indicator was the highest - 34 in 2002, and the lowest 0 in 2003. The trend for injuries per 1,000 incidents is dropping. Compared to the state value the number of injuries per 1,000 incidents is much lower.
Based on the reports from the years 2002 - 2018 the average number of fire-related casualties per year is 1. The highest number of reported casualties - 6 took place in 2002, and the lowest - 0 in 2003. The data has a declining trend.
The average number of injuries per 1,000 fire incidents is 5. This indicator was the highest - 34 in 2002, and the lowest 0 in 2003. The trend for injuries per 1,000 incidents is dropping. Compared to the state value the number of injuries per 1,000 incidents is much lower.Casualties per 1,000 incidents in Niles, MI compared to nearest cities:
(Note: Based on data for all years, including only cities with at least 500 fire incidents)
| Niles: | 4.7 |
| Buchanan: | 0.0 |
| Granger: | 18.5 |
| Edwardsburg: | 1.6 |
| Notre Dame: | 14.6 |
| Berrien Springs: | 5.5 |
| South Bend: | 2.2 |
| Mishawaka: | 11.4 |
| Dowagiac: | 18.2 |
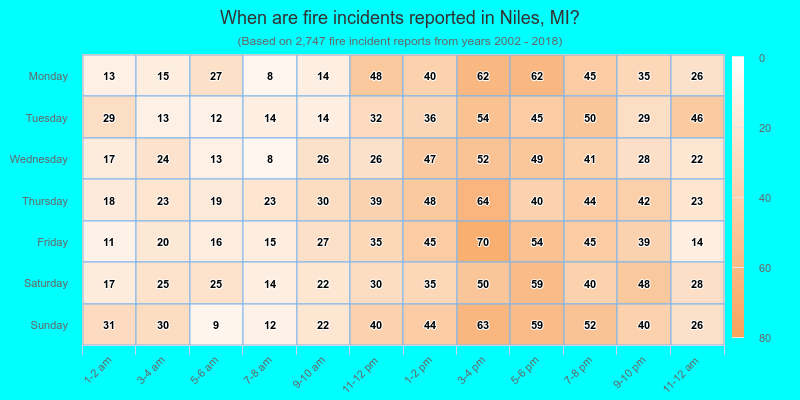
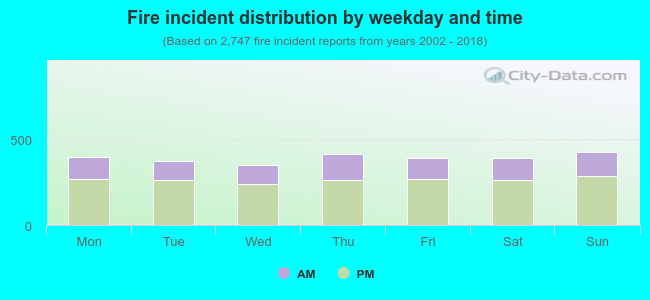 33.0% incidents where reported in the morning and 67.0% in the evening. The most fires (15.6%) took place on Sunday, and the least (12.9%) on Wednesday.
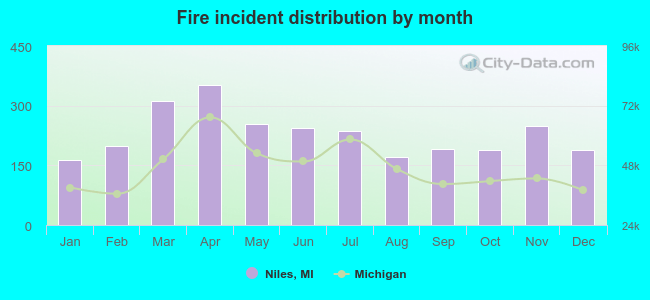 According to the 2,747 fires from years 2002 - 2018 most fires (12.9%) took place during April, and the least (5.9%) in January.
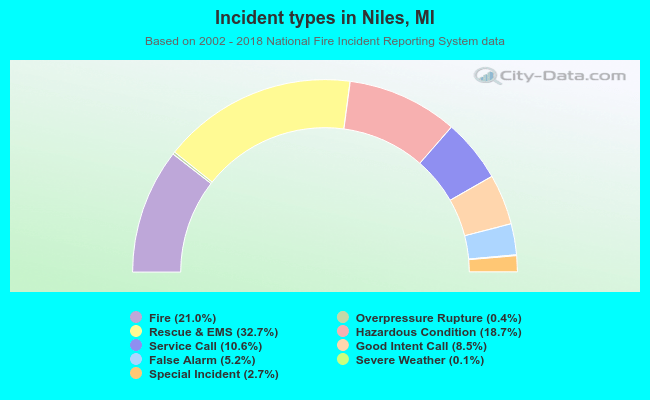 Out of all 13,071 cases reported during the years 2002 - 2018, the most belonged to the categories: Rescue & EMS (32.7%), Fire (21.0%), and Hazardous Condition (18.7%).
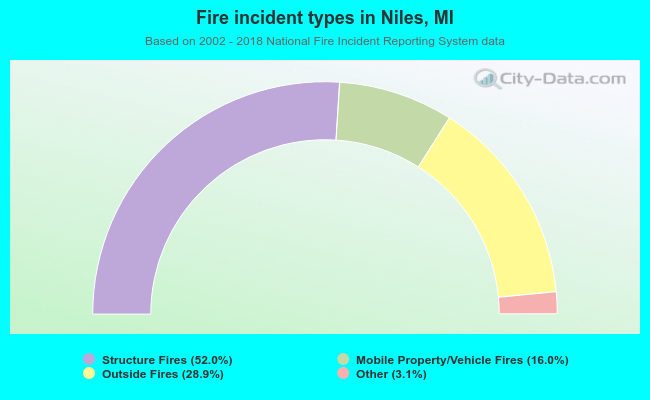 When looking into fire subcategories, the most reports belonged to: Structure Fires (52.0%), and Outside Fires (28.9%).