Mishawaka: Fire Incidents, Indiana (IN)
Where are fire incidents reported in Mishawaka, IN
Something went wrong! Please refresh the page.
| Fire incidents reported | |
|---|---|
| Sreet name | Count |
| MAIN ST | 166 |
| GRAPE RD | 140 |
| MCKINLEY AVE | 120 |
| LINCOLNWAY EAST | 92 |
| HICKORY RD | 82 |
| FOURTH ST | 78 |
| SIXTH ST | 66 |
| BREMEN HWY | 58 |
| LINCOLNWAY HWY | 58 |
| DOUGLAS RD | 56 |
| MISHAWAKA AVE | 56 |
| FIR RD | 54 |
| MCKINLEY HWY | 52 |
| DAY RD | 50 |
| TWELFTH ST | 48 |
| JEFFERSON BLVD | 46 |
| LAWRENCE ST | 44 |
| EDISON RD | 38 |
| ELM RD | 38 |
| LINCOLNWAY | 34 |
| THIRD ST | 34 |
| BITTERSWEET RD | 32 |
| CEDAR ST | 32 |
| DOGWOOD RD | 32 |
| DRAGOON TRL | 32 |
| HOME ST | 32 |
| MERRIFIELD AVE | 32 |
| JACKSON RD | 30 |
| BYRKIT AVE | 28 |
| ELEVENTH ST | 28 |
| Other | 681 |
2003 - 2018 National Fire Incident Reporting System (NFIRS) incidents
- Incident types reported to NFIRS in Mishawaka, IN
- 12,14963.1%Rescue & EMS
- 2,36912.3%Fire
- 1,5718.2%Hazardous Condition
- 1,0525.5%Service Call
- 1,0375.4%False Alarm
- 1,0105.2%Good Intent Call
- 400.2%Special Incident
- 200.1%Overpressure Rupture
- Fire incident types reported to NFIRS in Mishawaka, IN
- 90638.2%Outside Fires
- 83935.4%Structure Fires
- 45419.2%Mobile Property/Vehicle Fires
- 1707.2%Other
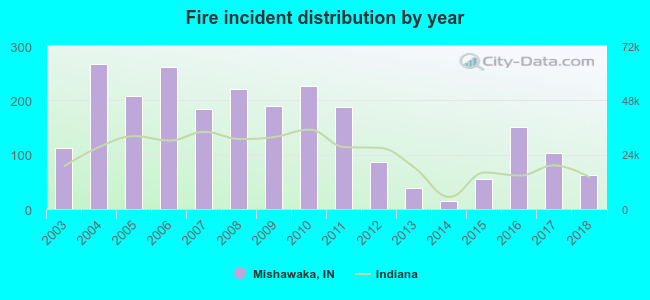 According to the data from the years 2003 - 2018 the average number of fire incidents per year is 148. The highest number of reported fire incidents - 267 took place in 2004, and the least - 14 in 2014. The data has a dropping trend.
The average number of yearly fire incidents per 10k residents in Mishawaka, IN compared to nearest cities:
(Note: Based on data for the last 3 years, including only cities with population 5,000 and above)
| Mishawaka: | 21.9 |
| Notre Dame: | 36.8 |
| South Bend: | 26.3 |
| Granger: | 15.5 |
| Elkhart: | 14.4 |
| Nappanee: | 37.2 |
| Goshen: | 26.1 |
| Plymouth: | 24.4 |
| La Porte: | 21.5 |
 The median response time based on all reported fire incidents is 5 minutes. This is lower compared to the Indiana median value.
The median response time in Mishawaka, IN compared to nearest cities:
(Note: Based on data for all years, including only cities with at least 500 fire incidents)
| Mishawaka: | 5 minutes |
| Notre Dame: | 2 minutes |
| South Bend: | 5 minutes |
| Osceola: | 9 minutes |
| Granger: | 6 minutes |
| Elkhart: | 6 minutes |
| Nappanee: | 6 minutes |
| Goshen: | 6 minutes |
| Walkerton: | 8 minutes |
 Based on the reports from the years 2003 - 2018 the average number of fire-related yearly casualties is 2. The highest number of injuries - 6 took place in 2008, and the lowest - 0 in 2004. The data has a dropping trend.
The average number of injuries per 1,000 fires is 10. This indicator was the highest - 32 in 2011, and the lowest 0 in 2004. The trend for casualties per 1,000 incidents is decreasing. Compared to the state value the number of casualties per 1,000 incidents is higher.
Based on the reports from the years 2003 - 2018 the average number of fire-related yearly casualties is 2. The highest number of injuries - 6 took place in 2008, and the lowest - 0 in 2004. The data has a dropping trend.
The average number of injuries per 1,000 fires is 10. This indicator was the highest - 32 in 2011, and the lowest 0 in 2004. The trend for casualties per 1,000 incidents is decreasing. Compared to the state value the number of casualties per 1,000 incidents is higher.Casualties per 1,000 incidents in Mishawaka, IN compared to nearest cities:
(Note: Based on data for all years, including only cities with at least 500 fire incidents)
| Mishawaka: | 11.4 |
| Notre Dame: | 14.6 |
| South Bend: | 2.2 |
| Osceola: | 2.9 |
| Granger: | 18.5 |
| Elkhart: | 6.5 |
| Nappanee: | 18.1 |
| Goshen: | 7.3 |
| Walkerton: | 7.1 |
 29.7% incidents where reported in the morning and 70.3% in the evening. The most fires (17.1%) took place on Sunday, and the least (11.6%) on Wednesday.
 According to the 2,369 fires from years 2003 - 2018 most fires (12.3%) took place during April, and the least (5.1%) in December.
 Out of all 19,256 cases reported during the years 2003 - 2018, the most belonged to the categories: Rescue & EMS (63.1%), Fire (12.3%), and Hazardous Condition (8.2%).
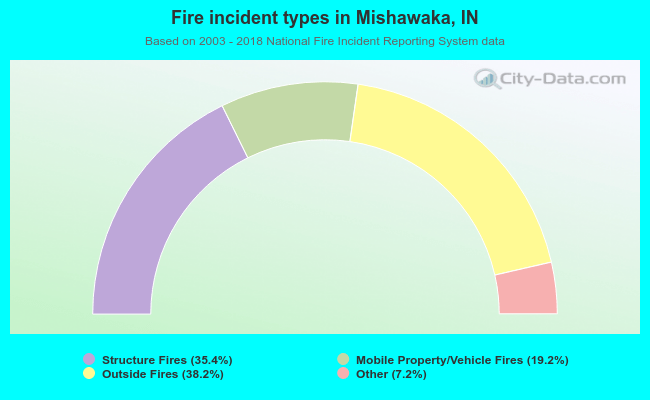 When looking into fire subcategories, the most incidents belonged to: Outside Fires (38.2%), and Structure Fires (35.4%).