Newnan: Fire Incidents, Georgia (GA)
Where are fire incidents reported in Newnan, GA
Something went wrong! Please refresh the page.
| Fire incidents reported | |
|---|---|
| Sreet name | Count |
| I-85 EXPY | 274 |
| BULLSBORO DR | 240 |
| HIGHWAY 29 | 232 |
| I85 | 166 |
| HIGHWAY 34 | 152 |
| HIGHWAY 16 | 124 |
| CORINTH RD | 122 |
| HWY. 16 EAST | 104 |
| HERRING RD | 84 |
| HWY. 29 SOUTH HWY | 80 |
| HWY. 29 NORTH HWY | 78 |
| TOMMY LEE COOK RD | 78 |
| I85 S | 72 |
| SMOKEY RD | 70 |
| HWY. 154 | 66 |
| LOWER FAYETTEVILLE RD | 64 |
| POPLAR RD | 64 |
| HWY. 34 EAST HWY | 62 |
| NEWNAN CROSSING BYP | 62 |
| MILLARD FARMER RD | 60 |
| COUNTRY CLUB RD | 58 |
| HWY. 34 WEST | 58 |
| WELCOME RD | 58 |
| HWY. 70 HWY | 56 |
| HEARTHSTONE DR | 52 |
| HWY. 54 HWY | 52 |
| JACKSON ST | 52 |
| FISCHER RD | 50 |
| HIGHWAY 70 | 50 |
| GREENVILLE ST | 48 |
| Other | 3,161 |
2002 - 2018 National Fire Incident Reporting System (NFIRS) incidents
- Incident types reported to NFIRS in Newnan, GA
- 50,67464.5%Rescue & EMS
- 7,5409.6%Good Intent Call
- 6,4658.2%Service Call
- 5,9497.6%Fire
- 4,3815.6%Hazardous Condition
- 3,0293.9%False Alarm
- 2900.4%Severe Weather
- 1460.2%Special Incident
- Fire incident types reported to NFIRS in Newnan, GA
- 3,57760.1%Outside Fires
- 1,40523.6%Structure Fires
- 93515.7%Mobile Property/Vehicle Fires
- 320.5%Other
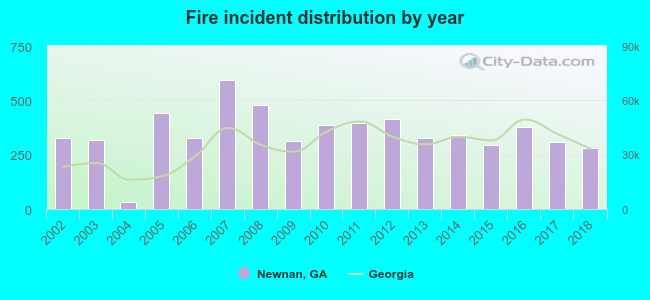 According to the data from the years 2002 - 2018 the average number of fires per year is 350. The highest number of reported fires - 595 took place in 2007, and the least - 33 in 2004. The data has a dropping trend.
The average number of yearly fire incidents per 10k residents in Newnan, GA compared to nearest cities:
(Note: Based on data for the last 3 years, including only cities with population 5,000 and above)
| Newnan: | 88.9 |
| Peachtree City: | 15.6 |
| Tyrone: | 30.8 |
| Fairburn: | 60.6 |
| Fayetteville: | 114.4 |
| Union City: | 69.7 |
| Carrollton: | 157.7 |
| Winston: | 27.5 |
| Riverdale: | 147.4 |
 The median response time based on all reported fire incidents is 6 minutes. This is close to the Georgia median value.
The median response time in Newnan, GA compared to nearest cities:
(Note: Based on data for all years, including only cities with at least 500 fire incidents)
| Newnan: | 6 minutes |
| Sharpsburg: | 6 minutes |
| Palmetto: | 6 minutes |
| Peachtree City: | 5 minutes |
| Senoia: | 7 minutes |
| Hogansville: | 7 minutes |
| Fairburn: | 6 minutes |
| Franklin: | 6 minutes |
| Fayetteville: | 6 minutes |
 According to the reports from the years 2002 - 2018 the average number of fire-related yearly deaths is 0. The highest number of reported deaths - 1 took place in 2015, and the lowest - 0 in 2002. The data has a constant trend.
The average number of fatalities per 1,000 fires is 1. This indicator was the highest - 3 in 2015, and the lowest 0 in 2002. The trend for deaths per 1,000 fire incidents is constant. Compared to the state value the number of fatalities per 1,000 incidents is much lower.
According to the reports from the years 2002 - 2018 the average number of fire-related yearly deaths is 0. The highest number of reported deaths - 1 took place in 2015, and the lowest - 0 in 2002. The data has a constant trend.
The average number of fatalities per 1,000 fires is 1. This indicator was the highest - 3 in 2015, and the lowest 0 in 2002. The trend for deaths per 1,000 fire incidents is constant. Compared to the state value the number of fatalities per 1,000 incidents is much lower.Deaths per 1,000 incidents in Newnan, GA compared to nearest cities:
(Note: Based on data for all years, including only cities with at least 2,500 fire incidents)
| Newnan: | 0.5 |
| Fayetteville: | 1.7 |
| Carrollton: | 2.3 |
| Riverdale: | 1.0 |
| Villa Rica: | 1.2 |
| Douglasville: | 0.2 |
| College Park: | 1.9 |
| Jonesboro: | 1.1 |
| LaGrange: | 1.9 |
 Based on the reports from the years 2002 - 2018 the average number of fire-related yearly casualties is 1. The highest number of casualties - 5 took place in 2009, and the lowest - 0 in 2002. The data has a constant trend.
The average number of casualties per 1,000 fires is 3. This indicator was the highest - 16 in 2009, and the lowest 0 in 2002. The trend for injuries per 1,000 fire incidents is rising. Compared to the Georgia value the number of casualties per 1,000 fire incidents is much lower.
Based on the reports from the years 2002 - 2018 the average number of fire-related yearly casualties is 1. The highest number of casualties - 5 took place in 2009, and the lowest - 0 in 2002. The data has a constant trend.
The average number of casualties per 1,000 fires is 3. This indicator was the highest - 16 in 2009, and the lowest 0 in 2002. The trend for injuries per 1,000 fire incidents is rising. Compared to the Georgia value the number of casualties per 1,000 fire incidents is much lower.Casualties per 1,000 incidents in Newnan, GA compared to nearest cities:
(Note: Based on data for all years, including only cities with at least 500 fire incidents)
| Newnan: | 3.2 |
| Sharpsburg: | 6.1 |
| Palmetto: | 6.6 |
| Peachtree City: | 3.8 |
| Senoia: | 0.0 |
| Hogansville: | 3.1 |
| Fairburn: | 7.5 |
| Franklin: | 2.0 |
| Fayetteville: | 12.2 |
 23.4% incidents where reported in the morning and 76.6% in the evening. The most fires (17.2%) took place on Saturday, and the least (12.7%) on Wednesday.
 According to the 5,949 reports from years 2002 - 2018 most fires (13.6%) took place during March, and the least (5.0%) in September.
 Out of all 78,537 cases reported during the years 2002 - 2018, the most belonged to the categories: Rescue & EMS (64.5%), Good Intent Call (9.6%), and Service Call (8.2%).
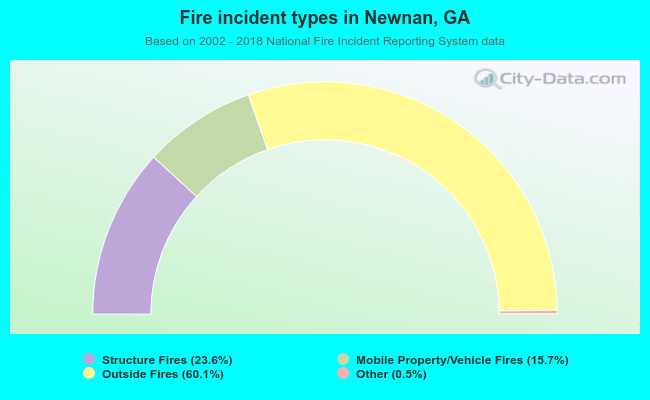 When looking into fire subcategories, the most incidents belonged to: Outside Fires (60.1%), and Structure Fires (23.6%).