Carrollton: Fire Incidents, Georgia (GA)
Where are fire incidents reported in Carrollton, GA
Something went wrong! Please refresh the page.
| Fire incidents reported | |
|---|---|
| Sreet name | Count |
| HIGHWAY 27 | 368 |
| LOVVORN RD | 270 |
| BANKHEAD HWY | 244 |
| PARK ST | 236 |
| HIGHWAY 166 | 230 |
| MAPLE ST | 230 |
| HIGHWAY 16 | 216 |
| SHADY GROVE RD | 148 |
| MT ZION RD | 134 |
| ALABAMA ST | 106 |
| HAYS MILL RD | 106 |
| HIGHWAY 5 | 102 |
| CLEM LOWELL RD | 100 |
| HIGHWAY 113 | 98 |
| HOG LIVER RD | 92 |
| COLUMBIA DR | 88 |
| CARROLLTON TYUS RD | 82 |
| HORSLEY MILL RD | 80 |
| NEWNAN RD | 80 |
| FRASHIER RD | 68 |
| HENSON CIR | 68 |
| BOWDON JUNCTION RD | 66 |
| CENTER POINT RD | 66 |
| SALE BARN RD | 66 |
| I-20 | 64 |
| WHOOPING CRK CH RD | 64 |
| PLEASANT RIDGE RD | 62 |
| CROSS PLAINS HULETT RD | 60 |
| MANDEVILLE RD | 60 |
| STEWART ST | 60 |
| Other | 2,285 |
2003 - 2018 National Fire Incident Reporting System (NFIRS) incidents
- Incident types reported to NFIRS in Carrollton, GA
- 20,84950.8%Rescue & EMS
- 5,99914.6%Fire
- 5,17012.6%Hazardous Condition
- 3,8409.4%Service Call
- 2,4576.0%False Alarm
- 2,2985.6%Good Intent Call
- 3440.8%Severe Weather
- 540.1%Special Incident
- Fire incident types reported to NFIRS in Carrollton, GA
- 2,77846.3%Outside Fires
- 2,24337.4%Structure Fires
- 93915.7%Mobile Property/Vehicle Fires
- 390.7%Other
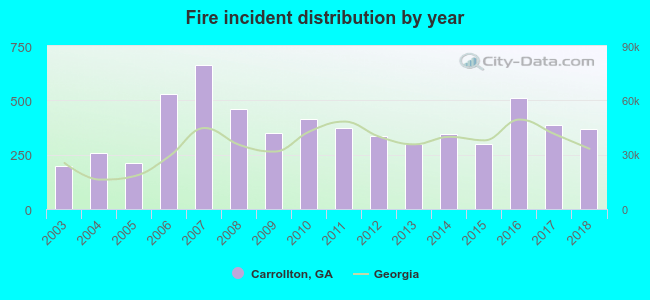 Based on the data from the years 2003 - 2018 the average number of fires per year is 375. The highest number of reported fire incidents - 663 took place in 2007, and the least - 199 in 2003. The data has a growing trend.
The average number of yearly fire incidents per 10k residents in Carrollton, GA compared to nearest cities:
(Note: Based on data for the last 3 years, including only cities with population 5,000 and above)
| Carrollton: | 157.7 |
| Bremen: | 159.5 |
| Villa Rica: | 115.0 |
| Winston: | 27.5 |
| Newnan: | 88.9 |
| Douglasville: | 66.4 |
| Dallas: | 203.0 |
| Lithia Springs: | 44.3 |
| Fairburn: | 60.6 |
 The median response time based on all reported fire incidents is 6 minutes. This is similar to the state median value.
The median response time in Carrollton, GA compared to nearest cities:
(Note: Based on data for all years, including only cities with at least 500 fire incidents)
| Carrollton: | 6 minutes |
| Bremen: | 6 minutes |
| Bowdon: | 7 minutes |
| Temple: | 7 minutes |
| Villa Rica: | 7 minutes |
| Winston: | 7 minutes |
| Buchanan: | 7 minutes |
| Tallapoosa: | 8 minutes |
| Franklin: | 6 minutes |
 According to the data from the years 2003 - 2018 the average number of fire-related fatalities per year is 1. The highest number of reported deaths - 2 took place in 2013, and the lowest - 0 in 2004. The data has a constant trend.
The average number of deaths per 1,000 fire incidents is 3. This indicator was the highest - 7 in 2013, and the lowest 0 in 2004. The trend for fatalities per 1,000 incidents is dropping. Compared to the Georgia value the number of fatalities per 1,000 incidents is similar.
According to the data from the years 2003 - 2018 the average number of fire-related fatalities per year is 1. The highest number of reported deaths - 2 took place in 2013, and the lowest - 0 in 2004. The data has a constant trend.
The average number of deaths per 1,000 fire incidents is 3. This indicator was the highest - 7 in 2013, and the lowest 0 in 2004. The trend for fatalities per 1,000 incidents is dropping. Compared to the Georgia value the number of fatalities per 1,000 incidents is similar.Deaths per 1,000 incidents in Carrollton, GA compared to nearest cities:
(Note: Based on data for all years, including only cities with at least 2,500 fire incidents)
| Carrollton: | 2.3 |
| Villa Rica: | 1.2 |
| Newnan: | 0.5 |
| Douglasville: | 0.2 |
| Dallas: | 1.7 |
| Austell: | 1.1 |
| Cedartown: | 1.6 |
| College Park: | 1.9 |
| Fayetteville: | 1.7 |
 Based on the data from the years 2003 - 2018 the average number of fire-related yearly casualties is 3. The highest number of reported casualties - 7 took place in 2010, and the lowest - 1 in 2003. The data has an increasing trend.
The average number of injuries per 1,000 fire incidents is 8. This indicator was the highest - 17 in 2014, and the lowest 3 in 2017. The trend for casualties per 1,000 incidents is increasing. Compared to the Georgia value the number of casualties per 1,000 incidents is about the same.
Based on the data from the years 2003 - 2018 the average number of fire-related yearly casualties is 3. The highest number of reported casualties - 7 took place in 2010, and the lowest - 1 in 2003. The data has an increasing trend.
The average number of injuries per 1,000 fire incidents is 8. This indicator was the highest - 17 in 2014, and the lowest 3 in 2017. The trend for casualties per 1,000 incidents is increasing. Compared to the Georgia value the number of casualties per 1,000 incidents is about the same.Casualties per 1,000 incidents in Carrollton, GA compared to nearest cities:
(Note: Based on data for all years, including only cities with at least 500 fire incidents)
| Carrollton: | 8.0 |
| Bremen: | 18.7 |
| Bowdon: | 2.7 |
| Temple: | 3.6 |
| Villa Rica: | 14.6 |
| Winston: | 0.0 |
| Buchanan: | 0.8 |
| Tallapoosa: | 16.2 |
| Franklin: | 2.0 |
 26.9% incidents where reported in the morning and 73.1% in the evening. The most fires (15.3%) took place on Saturday, and the least (13.4%) on Wednesday.
 According to the 5,999 fire incidents from years 2003 - 2018 most fires (11.7%) took place during March, and the least (6.1%) in August.
 Out of all 41,037 cases reported during the years 2003 - 2018, the most belonged to the categories: Rescue & EMS (50.8%), Fire (14.6%), and Hazardous Condition (12.6%).
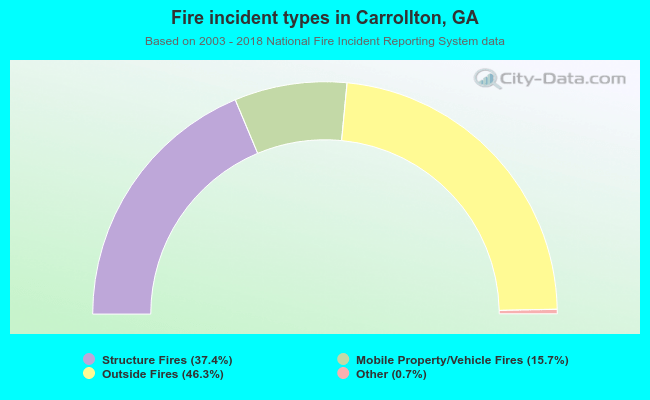 When looking into fire subcategories, the most reports belonged to: Outside Fires (46.3%), and Structure Fires (37.4%).