Newburyport: Fire Incidents, Massachusetts (MA)
Where are fire incidents reported in Newburyport, MA
Something went wrong! Please refresh the page.
|
| |||||||||||||||||||||||||||||||||||||||||||||||||||||||||||||||||||||||||||||||||||||||||||||||||||||||||||||
2002 - 2018 National Fire Incident Reporting System (NFIRS) incidents
- Incident types reported to NFIRS in Newburyport, MA
- 31346.7%Fire
- 21331.8%Rescue & EMS
- 7411.0%Good Intent Call
- 375.5%Service Call
- 304.5%Hazardous Condition
- 20.3%Special Incident
- 10.1%False Alarm
- Fire incident types reported to NFIRS in Newburyport, MA
- 20465.2%Structure Fires
- 6219.8%Mobile Property/Vehicle Fires
- 319.9%Other
- 165.1%Outside Fires
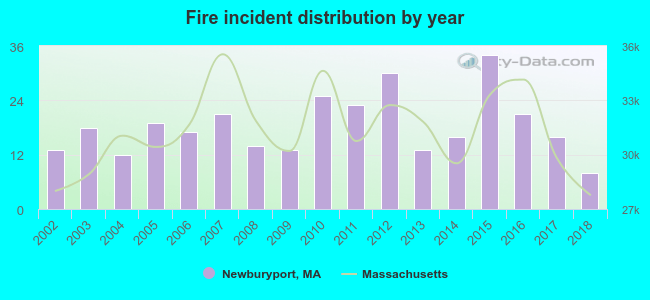 Based on the data from the years 2002 - 2018 the average number of fire incidents per year is 18. The highest number of reported fires - 34 took place in 2015, and the least - 8 in 2018. The data has a dropping trend.
The average number of yearly fire incidents per 10k residents in Newburyport, MA compared to nearest cities:
(Note: Based on data for the last 3 years, including only cities with population 5,000 and above)
| Newburyport: | 8.4 |
| Newbury: | 30.5 |
| Amesbury: | 35.3 |
| Merrimac: | 68.9 |
| Georgetown: | 55.4 |
| Groveland: | 32.5 |
| Haverhill: | 33.9 |
| Hamilton: | 21.5 |
| North Andover: | 38.9 |

 According to the data from the years 2002 - 2018 the average number of fire-related casualties per year is 2. The highest number of reported injuries - 11 took place in 2005, and the lowest - 0 in 2002. The data has a growing trend.
 33.5% incidents where reported in the morning and 66.5% in the evening. The most fires (16.9%) took place on Sunday, and the least (11.5%) on Thursday.
 Based on the 313 fire incidents from years 2002 - 2018 most fires (11.8%) took place during August, and the least (4.8%) in October.
 Out of all 670 cases reported during the years 2002 - 2018, the most belonged to the categories: Fire (46.7%), Overpressure Rupture (31.8%), and Service Call (11.0%).
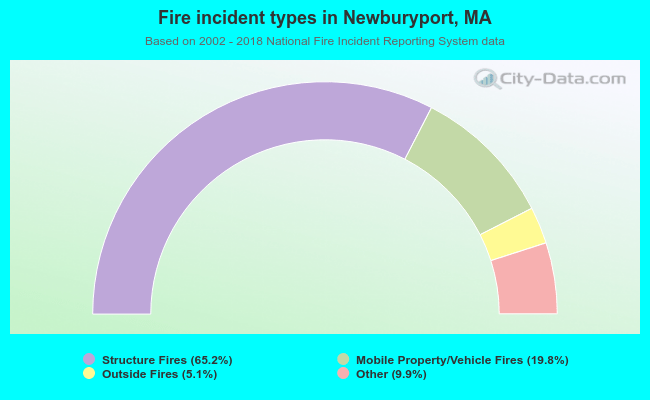 When looking into fire subcategories, the most reports belonged to: Structure Fires (65.2%), and Mobile Property/Vehicle Fires (19.8%).