Georgetown: Fire Incidents, Massachusetts (MA)
Where are fire incidents reported in Georgetown, MA
Something went wrong! Please refresh the page.
| Fire incidents reported | |
|---|---|
| Sreet name | Count |
| TRESTLE WAY | 188 |
| LAUREL LN | 144 |
| EAST MAIN ST | 80 |
| HEMLOCK LN | 66 |
| CENTRAL ST | 62 |
| SPRUCE LN | 62 |
| JEWETT ST | 60 |
| NELSON ST | 44 |
| ANDOVER ST | 38 |
| NORTH ST | 30 |
| WEST MAIN ST | 30 |
| ELM ST | 26 |
| PATRIOT LN | 26 |
| BELLEAU WOODS | 24 |
| BALDPATE RD | 16 |
| CHARLES ST | 16 |
| TENNEY ST | 16 |
| OLD JACOBS RD | 14 |
| THURLOW ST | 14 |
| WARREN ST | 12 |
| EAST MAIN ST. | 10 |
| PILLSBURY LN | 10 |
| TRESTLE WAY | 10 |
| WEST ST | 10 |
| BAILEY LN | 8 |
| JEWETT ST. | 8 |
| MAIN ST | 8 |
| EAST ST | 6 |
| EMILY LN | 6 |
| HART CIR | 6 |
2005 - 2018 National Fire Incident Reporting System (NFIRS) incidents
- Incident types reported to NFIRS in Georgetown, MA
- 3,12038.0%Service Call
- 2,66132.5%Rescue & EMS
- 7058.6%Fire
- 6437.8%False Alarm
- 6377.8%Hazardous Condition
- 4105.0%Good Intent Call
- 140.2%Severe Weather
- 90.1%Overpressure Rupture
- Fire incident types reported to NFIRS in Georgetown, MA
- 54377.0%Structure Fires
- 10615.0%Outside Fires
- 446.2%Mobile Property/Vehicle Fires
- 121.7%Other
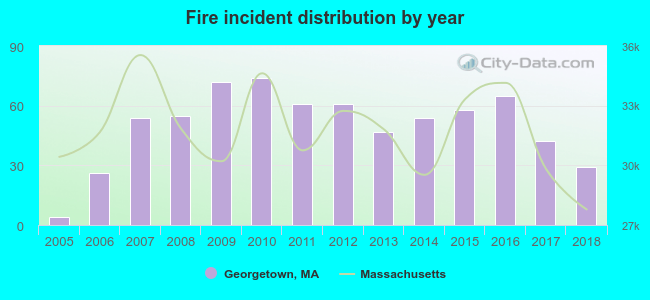 According to the data from the years 2005 - 2018 the average number of fire incidents per year is 50. The highest number of reported fire incidents - 74 took place in 2010, and the least - 4 in 2005. The data has a growing trend.
The average number of yearly fire incidents per 10k residents in Georgetown, MA compared to nearest cities:
(Note: Based on data for the last 3 years, including only cities with population 5,000 and above)
| Georgetown: | 55.4 |
| Groveland: | 32.5 |
| Haverhill: | 33.9 |
| North Andover: | 38.9 |
| Merrimac: | 68.9 |
| Newbury: | 30.5 |
| Newburyport: | 8.4 |
| Middleton: | 34.9 |
| Amesbury: | 35.3 |
 The median response time based on all reported fire incidents is 5 minutes. This is higher compared to the state median value.
The median response time in Georgetown, MA compared to nearest cities:
(Note: Based on data for all years, including only cities with at least 500 fire incidents)
| Georgetown: | 5 minutes |
| Boxford: | 8 minutes |
| Rowley: | 7 minutes |
| Haverhill: | 4 minutes |
| Topsfield: | 4 minutes |
| North Andover: | 4 minutes |
| Merrimac: | 5 minutes |
| Ipswich: | 5 minutes |
| Middleton: | 4 minutes |
 According to the reports from the years 2005 - 2018 the average number of fire-related yearly casualties is 1. The highest number of casualties - 2 took place in 2005, and the lowest - 0 in 2006. The data has a decreasing trend.
The average number of casualties per 1,000 fires is 43. This indicator was the highest - 500 in 2005, and the lowest 0 in 2006. The trend for injuries per 1,000 fires is decreasing. Compared to the state value the number of casualties per 1,000 fire incidents is about the same.
According to the reports from the years 2005 - 2018 the average number of fire-related yearly casualties is 1. The highest number of casualties - 2 took place in 2005, and the lowest - 0 in 2006. The data has a decreasing trend.
The average number of casualties per 1,000 fires is 43. This indicator was the highest - 500 in 2005, and the lowest 0 in 2006. The trend for injuries per 1,000 fires is decreasing. Compared to the state value the number of casualties per 1,000 fire incidents is about the same.
 30.6% incidents where reported in the morning and 69.4% in the evening. The most fires (16.6%) took place on Saturday, and the least (10.9%) on Friday.
 According to the 705 reports from years 2005 - 2018 most fires (10.8%) took place during April, and the least (6.5%) in July.
 Out of all 8,200 cases reported during the years 2005 - 2018, the most belonged to the categories: Service Call (38.0%), Rescue & EMS (32.5%), and Fire (8.6%).
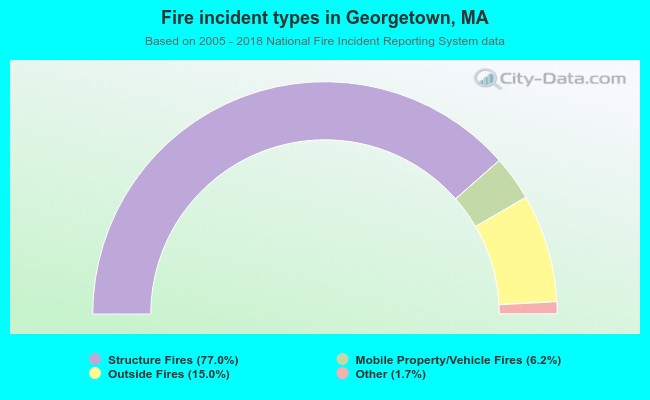 When looking into fire subcategories, the most incidents belonged to: Structure Fires (77.0%), and Outside Fires (15.0%).