Newark: Fire Incidents, Ohio (OH)
Where are fire incidents reported in Newark, OH
Something went wrong! Please refresh the page.
| Fire incidents reported | |
|---|---|
| Sreet name | Count |
| MAIN ST | 520 |
| 21ST ST | 274 |
| CHURCH ST | 224 |
| CASE AVE | 168 |
| MT VERNON RD | 144 |
| 5TH ST | 116 |
| HUDSON AVE | 104 |
| 3RD ST | 88 |
| MT. VERNON RD | 82 |
| EASTERN AVE | 76 |
| 4TH ST | 74 |
| TAMARACK RD | 74 |
| 6TH ST | 72 |
| 2ND ST | 68 |
| CEDAR ST | 68 |
| FALLSBURG RD | 66 |
| GRANVILLE ST | 64 |
| MOULL ST | 64 |
| UNION ST | 64 |
| KING RD | 62 |
| SHARON VALLEY RD | 60 |
| SR 16 | 60 |
| ELMWOOD AVE | 56 |
| MARTINSBURG RD | 56 |
| DAYTON RD | 54 |
| EDDYBURG RD | 54 |
| PRICE RD | 54 |
| WESTMOOR AVE | 54 |
| CHERRY VALLEY RD | 52 |
| MARNE RD | 52 |
| Other | 2,389 |
2002 - 2018 National Fire Incident Reporting System (NFIRS) incidents
- Incident types reported to NFIRS in Newark, OH
- 9,30732.1%Rescue & EMS
- 5,41318.6%Fire
- 5,07517.5%Good Intent Call
- 4,04213.9%Service Call
- 3,67612.7%Hazardous Condition
- 1,4375.0%False Alarm
- 440.2%Overpressure Rupture
- Fire incident types reported to NFIRS in Newark, OH
- 3,29160.8%Structure Fires
- 1,41826.2%Outside Fires
- 67612.5%Mobile Property/Vehicle Fires
- 280.5%Other
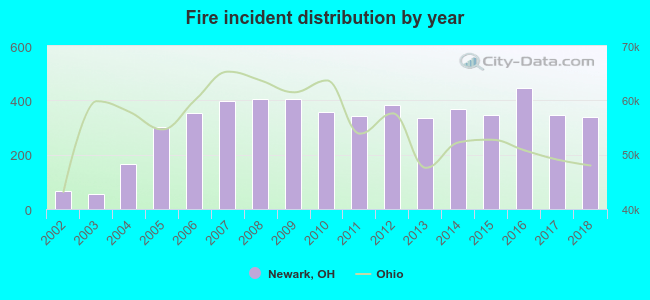 Based on the data from the years 2002 - 2018 the average number of fire incidents per year is 318. The highest number of fire incidents - 445 took place in 2016, and the least - 56 in 2003. The data has a rising trend.
The average number of yearly fire incidents per 10k residents in Newark, OH compared to nearest cities:
(Note: Based on data for the last 3 years, including only cities with population 5,000 and above)
| Newark: | 78.7 |
| Heath: | 58.0 |
| Granville: | 67.0 |
| Pataskala: | 73.5 |
| New Albany: | 42.0 |
| Reynoldsburg: | 28.7 |
| Pickerington: | 30.2 |
| Zanesville: | 123.2 |
| Mount Vernon: | 60.2 |
 The median response time based on all reported fire incidents is 6 minutes. This is about the same as the Ohio median value.
The median response time in Newark, OH compared to nearest cities:
(Note: Based on data for all years, including only cities with at least 500 fire incidents)
| Newark: | 6 minutes |
| Heath: | 6 minutes |
| Granville: | 6 minutes |
| Hebron: | 7 minutes |
| Buckeye Lake: | 7 minutes |
| Thornville: | 10 minutes |
| Utica: | 11 minutes |
| Millersport: | 7 minutes |
| Johnstown: | 8 minutes |
 According to the data from the years 2002 - 2018 the average number of fire-related yearly deaths is 0. The highest number of deaths - 2 took place in 2009, and the lowest - 0 in 2002. The data has an increasing trend.
The average number of deaths per 1,000 fires is 1. This indicator was the highest - 5 in 2009, and the lowest 0 in 2002. The trend for fatalities per 1,000 fires is increasing. Compared to the state value the number of deaths per 1,000 fire incidents is lower.
According to the data from the years 2002 - 2018 the average number of fire-related yearly deaths is 0. The highest number of deaths - 2 took place in 2009, and the lowest - 0 in 2002. The data has an increasing trend.
The average number of deaths per 1,000 fires is 1. This indicator was the highest - 5 in 2009, and the lowest 0 in 2002. The trend for fatalities per 1,000 fires is increasing. Compared to the state value the number of deaths per 1,000 fire incidents is lower.Deaths per 1,000 incidents in Newark, OH compared to nearest cities:
(Note: Based on data for all years, including only cities with at least 2,500 fire incidents)
| Newark: | 1.5 |
| Zanesville: | 3.0 |
| Lancaster: | 0.8 |
 Based on the data from the years 2002 - 2018 the average number of fire-related casualties per year is 6. The highest number of injuries - 16 took place in 2008, and the lowest - 0 in 2002. The data has an increasing trend.
The average number of injuries per 1,000 fire incidents is 18. This indicator was the highest - 40 in 2008, and the lowest 0 in 2002. The trend for casualties per 1,000 fires is increasing. Compared to the state value the number of casualties per 1,000 fires is higher.
Based on the data from the years 2002 - 2018 the average number of fire-related casualties per year is 6. The highest number of injuries - 16 took place in 2008, and the lowest - 0 in 2002. The data has an increasing trend.
The average number of injuries per 1,000 fire incidents is 18. This indicator was the highest - 40 in 2008, and the lowest 0 in 2002. The trend for casualties per 1,000 fires is increasing. Compared to the state value the number of casualties per 1,000 fires is higher.Casualties per 1,000 incidents in Newark, OH compared to nearest cities:
(Note: Based on data for all years, including only cities with at least 500 fire incidents)
| Newark: | 20.0 |
| Heath: | 4.4 |
| Granville: | 8.5 |
| Hebron: | 6.2 |
| Buckeye Lake: | 2.0 |
| Thornville: | 4.1 |
| Utica: | 0.0 |
| Millersport: | 6.8 |
| Johnstown: | 22.2 |
 33.3% incidents where reported in the morning and 66.7% in the evening. The most fires (14.7%) took place on Saturday, and the least (13.7%) on Thursday.
 Based on the 5,413 fires from years 2002 - 2018 most fires (11.2%) took place during March, and the least (6.6%) in August.
 Out of all 29,026 cases reported during the years 2002 - 2018, the most belonged to the categories: Rescue & EMS (32.1%), Fire (18.6%), and Good Intent Call (17.5%).
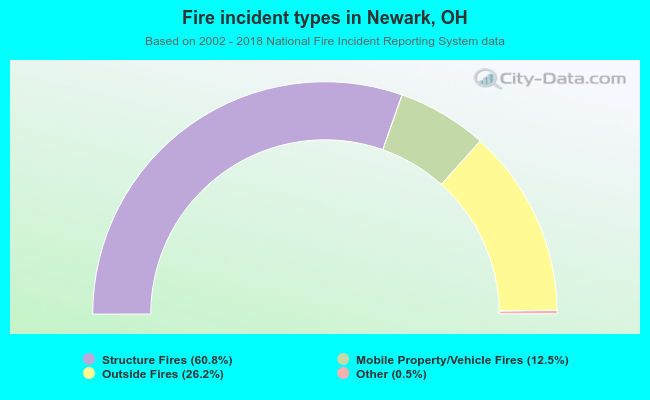 When looking into fire subcategories, the most reports belonged to: Structure Fires (60.8%), and Outside Fires (26.2%).