Pataskala: Fire Incidents, Ohio (OH)
Where are fire incidents reported in Pataskala, OH
Something went wrong! Please refresh the page.
| Fire incidents reported | |
|---|---|
| Sreet name | Count |
| BROAD ST | 176 |
| NATIONAL RD | 122 |
| MINK ST | 120 |
| YORK RD | 90 |
| MORSE RD | 88 |
| WATKINS RD | 88 |
| MAIN ST | 80 |
| HAZELTONETNA RD | 62 |
| HAZELTON-ETNA RD | 58 |
| PALMER RD | 56 |
| CEDAR ST | 52 |
| REFUGEE RD | 52 |
| SUMMIT RD | 50 |
| GRAHAM RD | 46 |
| OAK MEADOW DR | 46 |
| TAYLOR RD | 44 |
| CLEVELAND ST | 40 |
| OUTVILLE RD | 40 |
| CORONADO DR | 36 |
| MERRITT RD | 36 |
| CABLE RD | 32 |
| WORTHINGTON RD | 32 |
| BLACKS RD | 30 |
| MILL ST | 30 |
| ALWARD RD | 28 |
| COLUMBUS RD | 28 |
| WOODSIDE DR | 28 |
| BEECHER RD | 26 |
| HAVENS CORNER RD | 26 |
| BEAVER RUN RD | 24 |
| Other | 215 |
2002 - 2018 National Fire Incident Reporting System (NFIRS) incidents
- Incident types reported to NFIRS in Pataskala, OH
- 6,91550.7%Rescue & EMS
- 1,95214.3%Good Intent Call
- 1,88113.8%Fire
- 1,36910.0%Hazardous Condition
- 7295.3%Service Call
- 7005.1%False Alarm
- 440.3%Overpressure Rupture
- 400.3%Severe Weather
- Fire incident types reported to NFIRS in Pataskala, OH
- 84645.0%Structure Fires
- 65534.8%Outside Fires
- 35318.8%Mobile Property/Vehicle Fires
- 271.4%Other
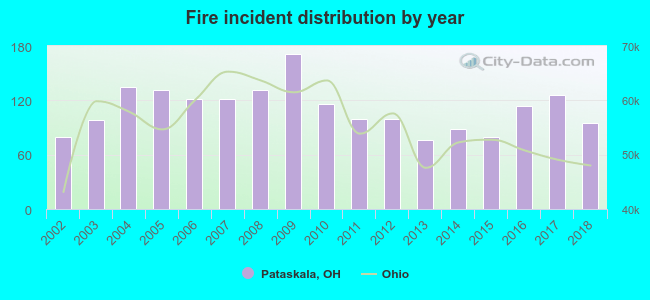 Based on the data from the years 2002 - 2018 the average number of fire incidents per year is 111. The highest number of reported fires - 171 took place in 2009, and the least - 76 in 2013. The data has a growing trend.
The average number of yearly fire incidents per 10k residents in Pataskala, OH compared to nearest cities:
(Note: Based on data for the last 3 years, including only cities with population 5,000 and above)
| Pataskala: | 73.5 |
| Reynoldsburg: | 28.7 |
| Pickerington: | 30.2 |
| New Albany: | 42.0 |
| Gahanna: | 20.2 |
| Whitehall: | 50.3 |
| Granville: | 67.0 |
| Canal Winchester: | 90.9 |
| Bexley: | 9.6 |
 The median response time based on all reported fire incidents is 7 minutes. This is about the same as the Ohio median value.
The median response time in Pataskala, OH compared to nearest cities:
(Note: Based on data for all years, including only cities with at least 500 fire incidents)
| Pataskala: | 7 minutes |
| Reynoldsburg: | 6 minutes |
| Pickerington: | 6 minutes |
| Gahanna: | 5 minutes |
| Whitehall: | 4 minutes |
| Johnstown: | 8 minutes |
| Granville: | 6 minutes |
| Millersport: | 7 minutes |
| Hebron: | 7 minutes |
 Based on the reports from the years 2002 - 2018 the average number of fire-related yearly casualties is 2. The highest number of reported casualties - 9 took place in 2009, and the lowest - 0 in 2004. The data has a dropping trend.
The average number of injuries per 1,000 fire incidents is 20. This indicator was the highest - 57 in 2007, and the lowest 0 in 2004. The trend for injuries per 1,000 incidents is decreasing. Compared to the Ohio value the number of casualties per 1,000 incidents is higher.
Based on the reports from the years 2002 - 2018 the average number of fire-related yearly casualties is 2. The highest number of reported casualties - 9 took place in 2009, and the lowest - 0 in 2004. The data has a dropping trend.
The average number of injuries per 1,000 fire incidents is 20. This indicator was the highest - 57 in 2007, and the lowest 0 in 2004. The trend for injuries per 1,000 incidents is decreasing. Compared to the Ohio value the number of casualties per 1,000 incidents is higher.Casualties per 1,000 incidents in Pataskala, OH compared to nearest cities:
(Note: Based on data for all years, including only cities with at least 500 fire incidents)
| Pataskala: | 22.3 |
| Reynoldsburg: | 22.3 |
| Pickerington: | 15.8 |
| Gahanna: | 7.5 |
| Whitehall: | 9.9 |
| Johnstown: | 22.2 |
| Granville: | 8.5 |
| Millersport: | 6.8 |
| Hebron: | 6.2 |
 31.6% incidents where reported in the morning and 68.4% in the evening. The most fires (17.4%) took place on Monday, and the least (11.1%) on Friday.
 According to the 1,881 reports from years 2002 - 2018 most fires (11.3%) took place during March, and the least (6.8%) in September.
 Out of all 13,642 cases reported during the years 2002 - 2018, the most belonged to the categories: Rescue & EMS (50.7%), Good Intent Call (14.3%), and Fire (13.8%).
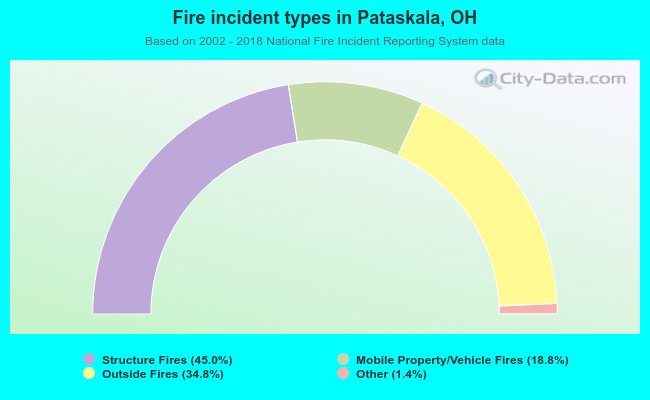 When looking into fire subcategories, the most incidents belonged to: Structure Fires (45.0%), and Outside Fires (34.8%).