Muskegon Heights: Fire Incidents, Michigan (MI)
Where are fire incidents reported in Muskegon Heights, MI
Something went wrong! Please refresh the page.
| Fire incidents reported | |
|---|---|
| Sreet name | Count |
| 6TH ST | 132 |
| SANFORD ST | 84 |
| 5TH ST | 80 |
| HOYT ST | 80 |
| 7TH ST | 76 |
| HOWDEN ST | 72 |
| PECK ST | 72 |
| JEFFERSON ST | 70 |
| 8TH ST | 64 |
| BAKER ST | 64 |
| MAFFETT ST | 64 |
| REYNOLDS ST | 62 |
| RIORDAN ST | 48 |
| 9TH ST | 40 |
| TEMPLE ST | 40 |
| WOOD ST | 38 |
| JARMAN ST | 36 |
| RAY ST | 36 |
| WAALKES ST | 30 |
| MCILWRAITH ST | 28 |
| GETTY ST | 26 |
| GLENDALE ST | 26 |
| PARK ST | 26 |
| WOODCLIFFE DR | 26 |
| LEAHY ST | 24 |
| LEMUEL ST | 24 |
| COLUMBIA AV | 22 |
| SHERMAN BL | 22 |
| SUPERIOR ST | 22 |
| DYSON ST | 20 |
2004 - 2018 National Fire Incident Reporting System (NFIRS) incidents
- Incident types reported to NFIRS in Muskegon Heights, MI
- 4,80359.1%Rescue & EMS
- 1,06513.1%Fire
- 7058.7%Good Intent Call
- 6818.4%Hazardous Condition
- 4655.7%False Alarm
- 4045.0%Service Call
- Fire incident types reported to NFIRS in Muskegon Heights, MI
- 59956.2%Structure Fires
- 26424.8%Outside Fires
- 16315.3%Mobile Property/Vehicle Fires
- 393.7%Other
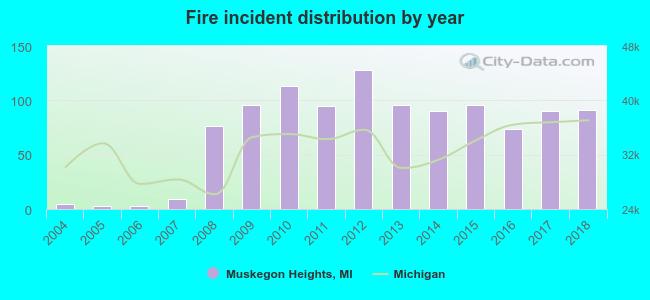 According to the data from the years 2004 - 2018 the average number of fires per year is 71. The highest number of fires - 128 took place in 2012, and the least - 3 in 2005. The data has an increasing trend.
The average number of yearly fire incidents per 10k residents in Muskegon Heights, MI compared to nearest cities:
(Note: Based on data for the last 3 years, including only cities with population 5,000 and above)
| Muskegon Heights: | 78.7 |
| Muskegon: | 62.4 |
| Norton Shores: | 37.9 |
| Grand Haven: | 74.8 |
| Allendale: | 24.8 |
| Walker: | 31.9 |
| Jenison: | 22.2 |
| Zeeland: | 75.2 |
| Hudsonville: | 68.7 |
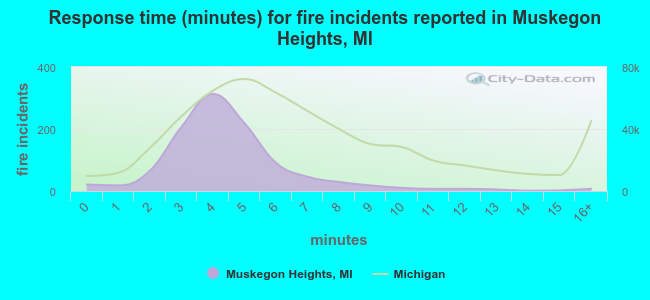 The median response time based on all reported fire incidents is 4 minutes. This is lower than the Michigan median value.
The median response time in Muskegon Heights, MI compared to nearest cities:
(Note: Based on data for all years, including only cities with at least 500 fire incidents)
| Muskegon Heights: | 4 minutes |
| Muskegon: | 4 minutes |
| Norton Shores: | 5 minutes |
| Spring Lake: | 7 minutes |
| Grand Haven: | 6 minutes |
| Twin Lake: | 10 minutes |
| Whitehall: | 9 minutes |
| Coopersville: | 8 minutes |
| Allendale: | 8 minutes |
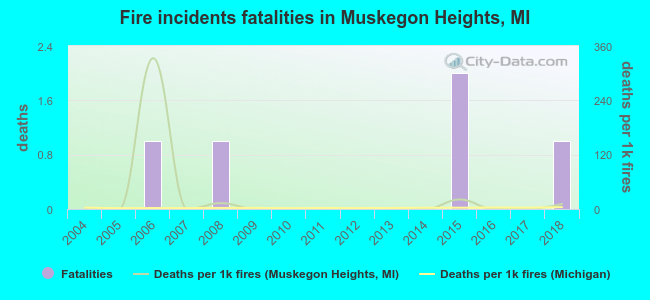 According to the reports from the years 2004 - 2018 the average number of fire-related yearly deaths is 0. The highest number of deaths - 2 took place in 2015, and the lowest - 0 in 2004. The data has a growing trend.
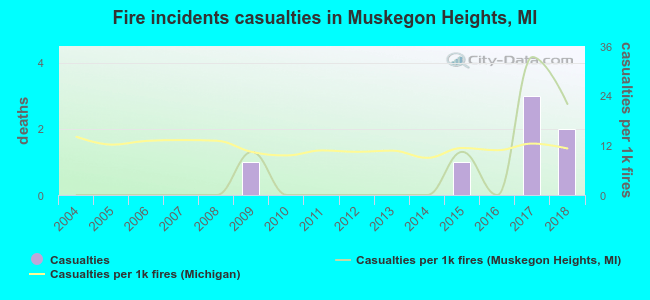 According to the reports from the years 2004 - 2018 the average number of fire-related casualties per year is 0. The highest number of casualties - 3 took place in 2017, and the lowest - 0 in 2004. The data has an increasing trend.
The average number of injuries per 1,000 fire incidents is 5. This indicator was the highest - 33 in 2017, and the lowest 0 in 2004. The trend for injuries per 1,000 fires is increasing. Compared to the state value the number of injuries per 1,000 fire incidents is lower.
According to the reports from the years 2004 - 2018 the average number of fire-related casualties per year is 0. The highest number of casualties - 3 took place in 2017, and the lowest - 0 in 2004. The data has an increasing trend.
The average number of injuries per 1,000 fire incidents is 5. This indicator was the highest - 33 in 2017, and the lowest 0 in 2004. The trend for injuries per 1,000 fires is increasing. Compared to the state value the number of injuries per 1,000 fire incidents is lower.Casualties per 1,000 incidents in Muskegon Heights, MI compared to nearest cities:
(Note: Based on data for all years, including only cities with at least 500 fire incidents)
| Muskegon Heights: | 6.6 |
| Muskegon: | 15.9 |
| Norton Shores: | 7.1 |
| Spring Lake: | 1.6 |
| Grand Haven: | 11.0 |
| Twin Lake: | 1.5 |
| Whitehall: | 0.0 |
| Coopersville: | 0.0 |
| Allendale: | 4.6 |
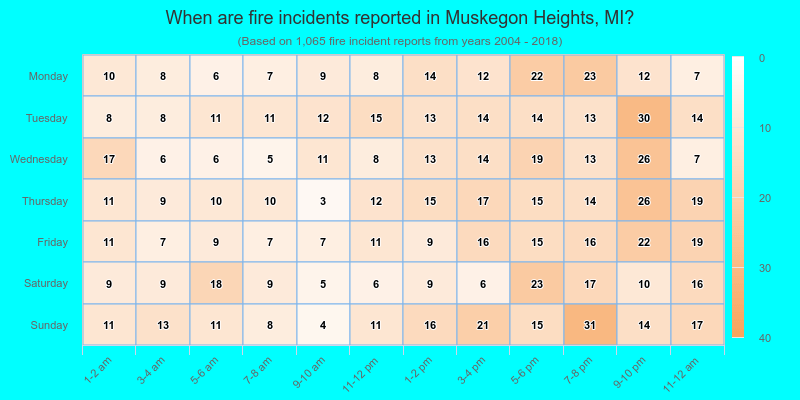
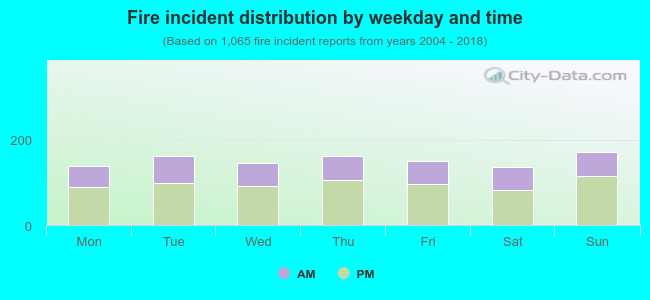 36.3% incidents where reported in the morning and 63.7% in the evening. The most fires (16.2%) took place on Sunday, and the least (12.9%) on Saturday.
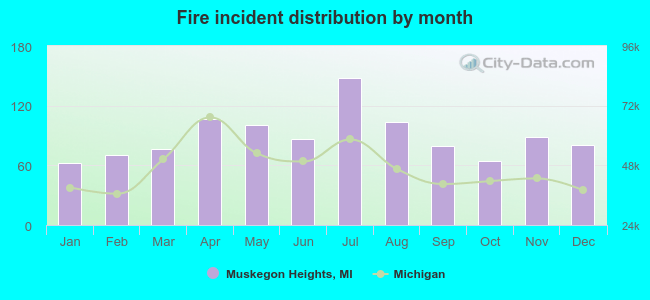 Based on the 1,065 fire incident reports from years 2004 - 2018 most fires (13.9%) took place during July, and the least (5.8%) in January.
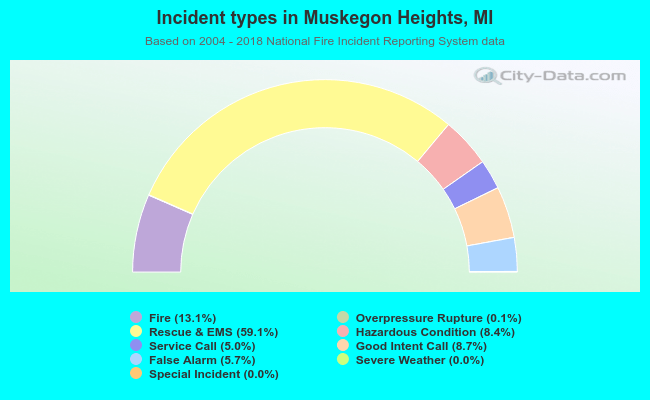 Out of all 8,133 cases reported during the years 2004 - 2018, the most belonged to the categories: Rescue & EMS (59.1%), Fire (13.1%), and Good Intent Call (8.7%).
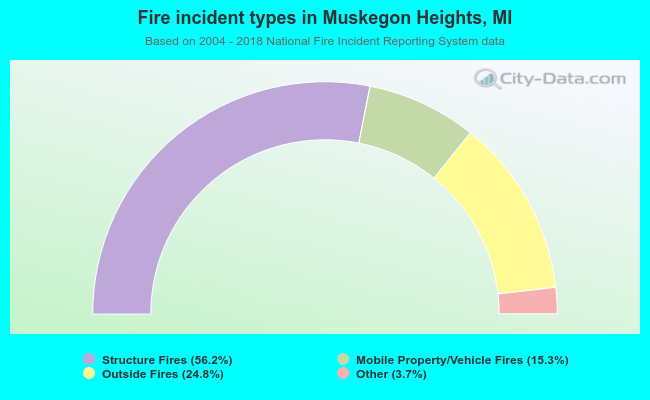 When looking into fire subcategories, the most reports belonged to: Structure Fires (56.2%), and Outside Fires (24.8%).