Allendale: Fire Incidents, Michigan (MI)
Where are fire incidents reported in Allendale, MI
Something went wrong! Please refresh the page.
|
| |||||||||||||||||||||||||||||||||||||||||||||||||||||||||||||||||||||||||||||||||||||||||||||||||||||||||||||
2002 - 2018 National Fire Incident Reporting System (NFIRS) incidents
- Incident types reported to NFIRS in Allendale, MI
- 3,80958.1%Rescue & EMS
- 1,01115.4%Good Intent Call
- 6489.9%Fire
- 3695.6%Service Call
- 3515.4%Hazardous Condition
- 3495.3%False Alarm
- 110.2%Severe Weather
- Fire incident types reported to NFIRS in Allendale, MI
- 37858.3%Structure Fires
- 16225.0%Outside Fires
- 8112.5%Mobile Property/Vehicle Fires
- 274.2%Other
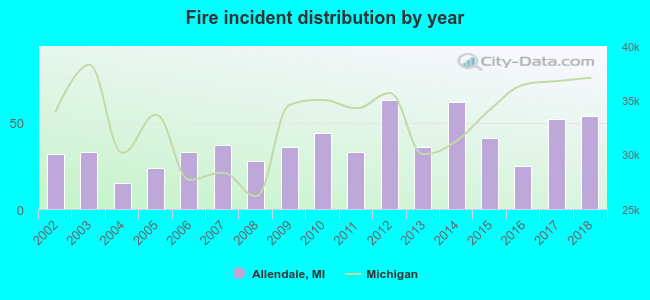 According to the data from the years 2002 - 2018 the average number of fires per year is 38. The highest number of reported fires - 63 took place in 2012, and the least - 15 in 2004. The data has a growing trend.
The average number of yearly fire incidents per 10k residents in Allendale, MI compared to nearest cities:
(Note: Based on data for the last 3 years, including only cities with population 5,000 and above)
| Allendale: | 24.8 |
| Jenison: | 22.2 |
| Hudsonville: | 68.7 |
| Walker: | 31.9 |
| Grandville: | 32.4 |
| Zeeland: | 75.2 |
| Wyoming: | 27.7 |
| Comstock Park: | 62.8 |
| Grand Rapids: | 42.6 |
 The median response time based on all reported fire incidents is 8 minutes. This is higher than the state median value.
The median response time in Allendale, MI compared to nearest cities:
(Note: Based on data for all years, including only cities with at least 500 fire incidents)
| Allendale: | 8 minutes |
| Coopersville: | 8 minutes |
| Hudsonville: | 6 minutes |
| Walker: | 9 minutes |
| Grandville: | 4 minutes |
| Zeeland: | 7 minutes |
| Wyoming: | 6 minutes |
| Spring Lake: | 7 minutes |
| Comstock Park: | 7 minutes |
 36.1% incidents where reported in the morning and 63.9% in the evening. The most fires (16.0%) took place on Monday, and the least (13.6%) on Thursday.
 Based on the 648 fire incident reports from years 2002 - 2018 most fires (11.0%) took place during March, and the least (4.8%) in May.
 Out of all 6,559 cases reported during the years 2002 - 2018, the most belonged to the categories: Rescue & EMS (58.1%), Good Intent Call (15.4%), and Fire (9.9%).
 When looking into fire subcategories, the most reports belonged to: Structure Fires (58.3%), and Outside Fires (25.0%).