Montague: Fire Incidents, Massachusetts (MA)
Where are fire incidents reported in Montague, MA
Something went wrong! Please refresh the page.
|
| |||||||||||||||||||||||||||||||||||||||||||||||||||||||||||||||||||||||||||||||||||||||||||||||||||||||||||||
2002 - 2018 National Fire Incident Reporting System (NFIRS) incidents
- Incident types reported to NFIRS in Montague, MA
- 13760.1%Fire
- 5323.2%Rescue & EMS
- 135.7%Good Intent Call
- 104.4%Service Call
- 83.5%False Alarm
- 62.6%Hazardous Condition
- 10.4%Special Incident
- Fire incident types reported to NFIRS in Montague, MA
- 7252.6%Structure Fires
- 5943.1%Outside Fires
- 42.9%Other
- 21.5%Mobile Property/Vehicle Fires
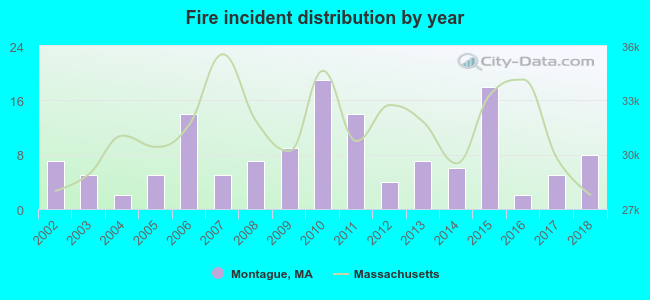 Based on the data from the years 2002 - 2018 the average number of fire incidents per year is 8. The highest number of reported fires - 19 took place in 2010, and the least - 2 in 2004. The data has a growing trend.
The average number of yearly fire incidents per 10k residents in Montague, MA compared to nearest cities:
(Note: Based on data for the last 3 years, including only cities with population 5,000 and above)
| Montague: | 5.9 |
| Greenfield: | 61.7 |
| Deerfield: | 20.2 |
| Amherst: | 19.9 |
| Hadley: | 23.5 |
| Athol: | 76.2 |
| Northampton: | 16.5 |
| Easthampton: | 27.6 |
| South Hadley: | 42.3 |

 31.4% incidents where reported in the morning and 68.6% in the evening. The most fires (18.2%) took place on Thursday, and the least (7.3%) on Sunday.
 According to the 137 reports from years 2002 - 2018 most fires (22.6%) took place during April, and the least (2.9%) in June.
 Out of all 228 cases reported during the years 2002 - 2018, the most belonged to the categories: Fire (60.1%), Overpressure Rupture (23.2%), and Service Call (5.7%).
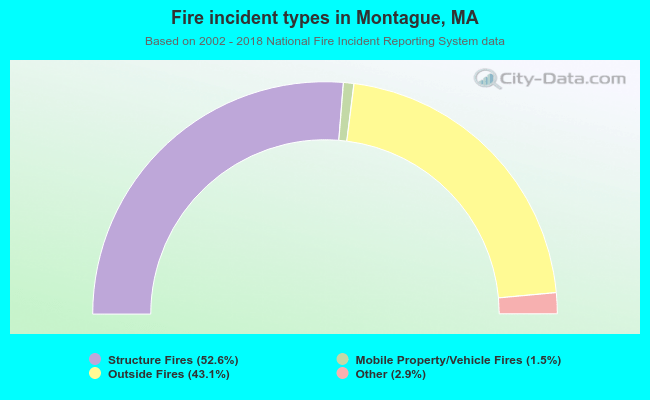 When looking into fire subcategories, the most reports belonged to: Structure Fires (52.6%), and Outside Fires (43.1%).